
Fig. 6.
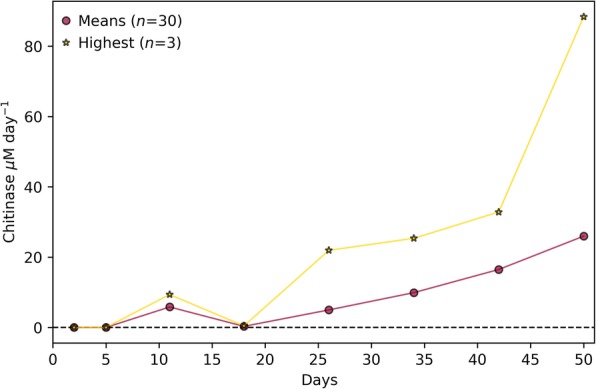
Chitinase activity of artificial selection experiment 2. The graph shows the mean chitinase activity of the positive selection, from which the mean of the random selection was subtracted. The means of all communities within the generation (n = 30; red) and those of only the three communities that were pooled for the inoculum of the next generation (yellow) are shown