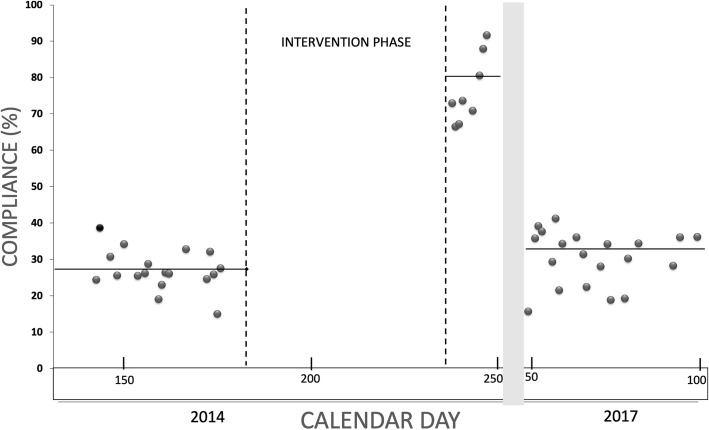
Fig. 2.
Time series of compliance rates per observation day. Dots indicate the compliance rates per observation day. The observations used to calculate the compliance rates per day were conducted in the baseline phase and the post-intervention phase in 2014, and in the long-term evaluation phase in 2017. The horizontal lines represent the average of compliance rate in each phase

