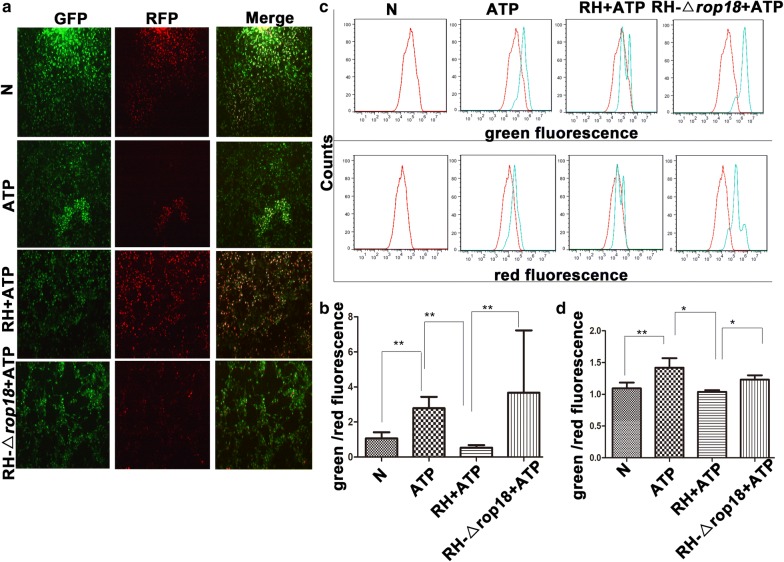
Fig. 8.
TgROP18 inhibition of ATP-induced mitochondrial depolarization in SF268 cells. SF268 cells were infected with RH or RH-Δrop18 tachyzoites at MOI of 13 and followed by ATP induction of apoptosis. a Visualization of mitochondrial membrane depolarization by JC-1 staining and fluorescence microscopy (10×). c Flow cytometric analysis of mitochondrial membrane depolarization. b, d Quantification of mitochondrial membrane depolarization. The percentages of green to red fluorescence were determined using a fluorescence microscope and FCM for each group of cells. The experiments were repeated four times. The values were analyzed using the Kruskal–Wallis H-test and Bonferroni correction (**P < 0.01, *P < 0.05)

