The original publication by Jeong et al. (2012) contained inadvertent duplications in the cell invasion assay images presented in Figs 1D and 4D. The authors have corrected this by providing the original whole filter images for Figs 1 and 4 , and the revised figures and legends are included here. All authors agree to this corrigendum.
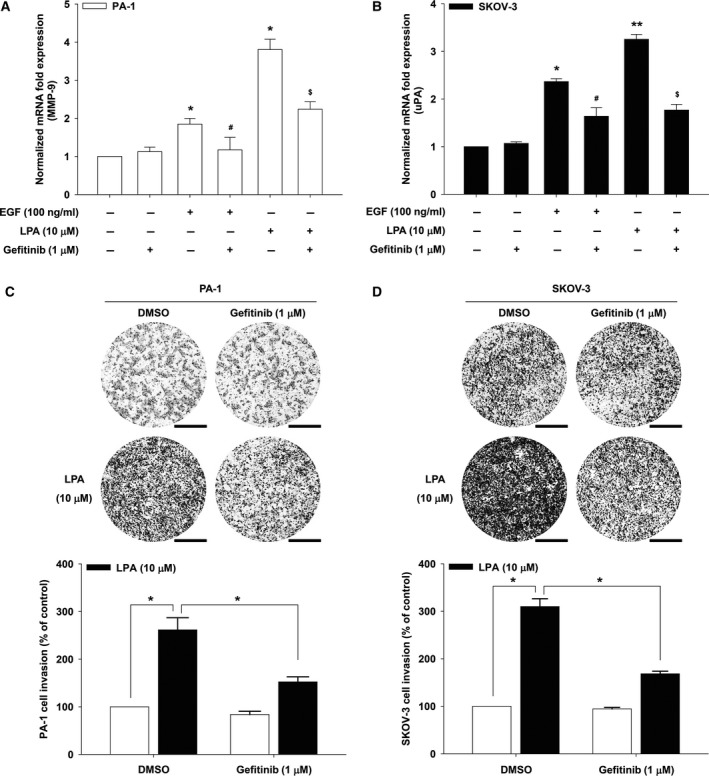
Figure 1.

EGFR is important for proteolytic enzyme expression and ovarian cancer invasion. The serum‐starved PA‐1 (A) and SKOV‐3 (B) cells were pretreated with gefitinib for 1 h and then stimulated with LPA for 24 h. mRNA expression of MMP‐9 and uPA by quantitative RT‐PCR (error bars, ± SD *P < 0.01 and **P < 0.001 vs control, #P < 0.05 vs EGF treatment only, and $P < 0.05 vs LPA treatment only). The serum‐starved PA‐1 (C) and SKOV‐3 (D) cells were pretreated with gefitinib for 1 h, and in vitro invasion was analyzed by utilizing modified Boyden chamber with Matrigel‐coated polycarbonate filters against LPA (error bars, ± SD *P < 0.01). The values (compared with DMSO control) obtained were calculated using the number of invaded cells. Invaded cells were counted with imagej (NIH) software (image type: 16 bit, auto threshold) analyzing particles [size (pixel2): 100‐infinity, circularity: 0.00–1.00, exclude holes] from three filters. Scale bar, 500 µm. All experiments were repeated three times.
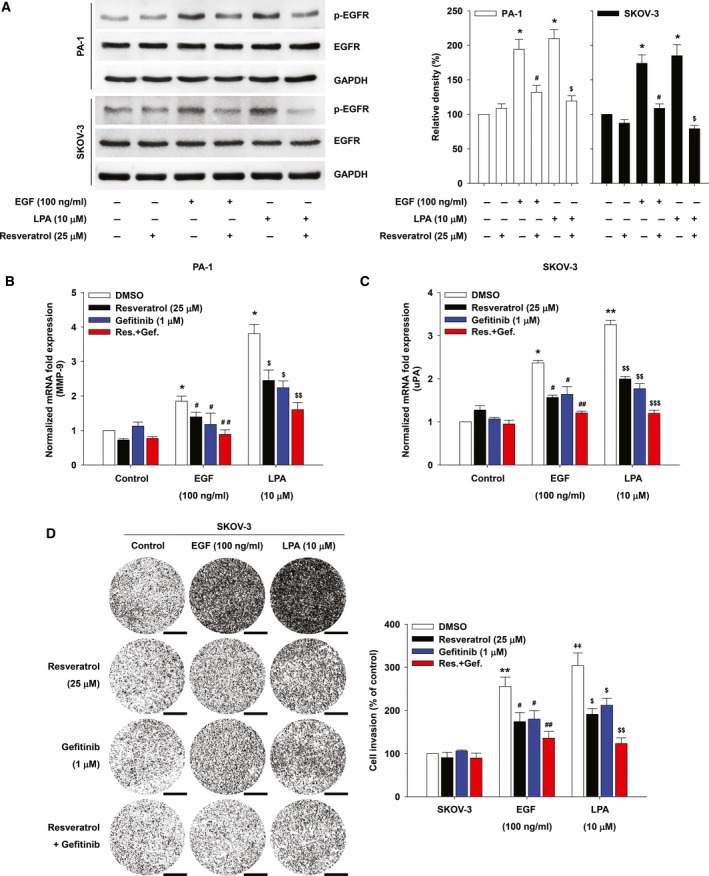
Figure 4.

Resveratrol inhibits LPA‐induced EGFR phosphorylation and ovarian cancer cell invasion. (A) The serum‐starved cells were pretreated with resveratrol for 1 h and then stimulated with EGF or LPA for 5 min. Densitometric analysis is representative of three independent experiments. The histograms show the ratio between active and total EGFR protein levels (error bars, ± SD *P < 0.05 vs control, #P < 0.05 vs EGF treatment only, and $P < 0.05 vs LPA treatment only). The serum‐starved PA‐1 (B) and SKOV‐3 (C) cells were pretreated with indicated agents for 1 h and then stimulated with EGF and LPA for 24 h. mRNA expression of MMP‐9 (B) and uPA (C) by quantitative RT‐PCR (error bars, ± SD *P < 0.01 and **P < 0.001 vs control, #P < 0.05 and ##P < 0.01 vs EGF treatment only, and $P < 0.05, $$P < 0.01, and $$$P < 0.001 vs LPA treatment only). (D) The serum‐starved SKOV‐3 cells were pretreated with indicated agents for 1 h, and in vitro invasion was analyzed by utilizing modified Boyden chamber with Matrigel‐coated polycarbonate filters against EGF or LPA (error bars, ± SD *P < 0.01 vs control, #P < 0.05 and ##P < 0.01 vs EGF treatment only, and $P < 0.05 and $$P < 0.01 vs LPA treatment only). The values (compared with DMSO control) obtained were calculated using the number of invaded cells. Invaded cells were counted with imagej (NIH) software (image type: 16 bit, auto threshold) analyzing particles [size (pixel2): 100‐infinity, circularity: 0.00–1.00, exclude holes] from three filters. Scale bar, 500 µm. All experiments were repeated three times.
The authors apologize for any inconvenience caused.
Reference
- Jeong KJ, Cho KH, Panupinthu N, Kim H, Kang J, Park CG, Mills GB and Lee HY (2012) EGFR mediates LPA‐induced proteolytic enzyme expression and ovarian cancer invasion: Inhibition by resveratrol. Mol Oncol 7, 121–129. [DOI] [PMC free article] [PubMed] [Google Scholar]


