
Figure 4.
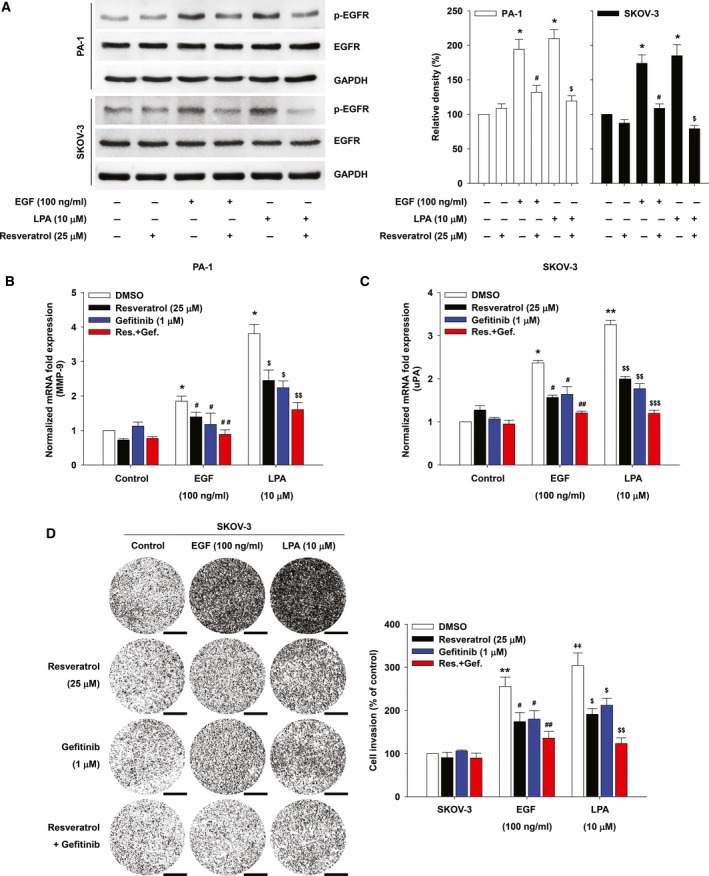
Resveratrol inhibits LPA‐induced EGFR phosphorylation and ovarian cancer cell invasion. (A) The serum‐starved cells were pretreated with resveratrol for 1 h and then stimulated with EGF or LPA for 5 min. Densitometric analysis is representative of three independent experiments. The histograms show the ratio between active and total EGFR protein levels (error bars, ± SD *P < 0.05 vs control, #P < 0.05 vs EGF treatment only, and $P < 0.05 vs LPA treatment only). The serum‐starved PA‐1 (B) and SKOV‐3 (C) cells were pretreated with indicated agents for 1 h and then stimulated with EGF and LPA for 24 h. mRNA expression of MMP‐9 (B) and uPA (C) by quantitative RT‐PCR (error bars, ± SD *P < 0.01 and **P < 0.001 vs control, #P < 0.05 and ##P < 0.01 vs EGF treatment only, and $P < 0.05, $$P < 0.01, and $$$P < 0.001 vs LPA treatment only). (D) The serum‐starved SKOV‐3 cells were pretreated with indicated agents for 1 h, and in vitro invasion was analyzed by utilizing modified Boyden chamber with Matrigel‐coated polycarbonate filters against EGF or LPA (error bars, ± SD *P < 0.01 vs control, #P < 0.05 and ##P < 0.01 vs EGF treatment only, and $P < 0.05 and $$P < 0.01 vs LPA treatment only). The values (compared with DMSO control) obtained were calculated using the number of invaded cells. Invaded cells were counted with imagej (NIH) software (image type: 16 bit, auto threshold) analyzing particles [size (pixel2): 100‐infinity, circularity: 0.00–1.00, exclude holes] from three filters. Scale bar, 500 µm. All experiments were repeated three times.