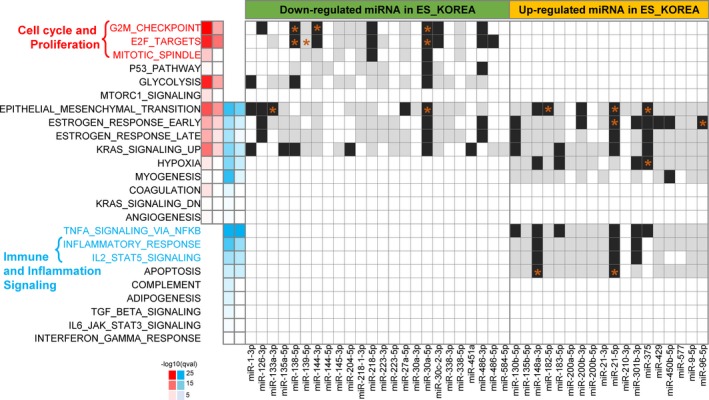
Figure 3.

Functional enriched terms of hallmark signatures from MSigDB and relevant miRNAs. The heatmap on the left indicates the q‐value of enrichment in −log10(q‐value) for DEGs where up‐ and downregulations in tumor samples are shown in red and blue colors, respectively. The first and third columns were calculated using all DEGs (935 up‐ and 1387 downregulated DEGs), and the second and fourth columns were obtained by using subset of DEGs that were targets of DEmiRs (452 up‐ and 562 downregulated DEGs). The black and white heatmap on the right indicates presence or absence of miRNAs targeting DEGs involved for each process where validated and predicted targets are indicated in black and gray colors, respectively. Target genes with literature evidence are marked with an asterisk where further details were provided in Table S5.
