Figure 5.

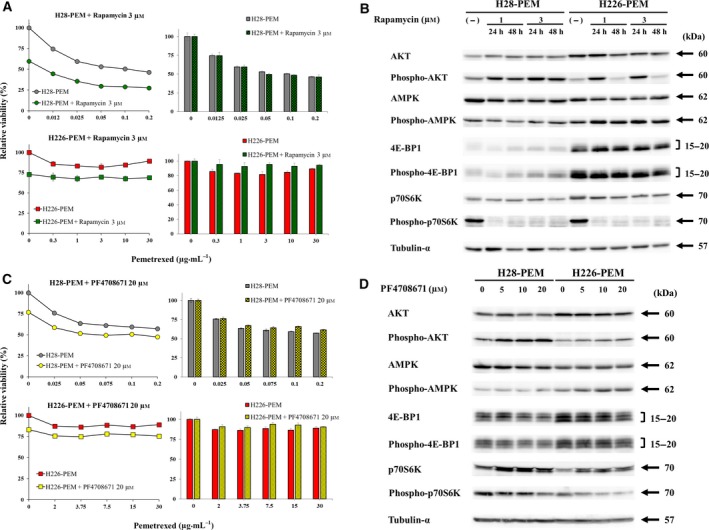
Inhibition of p70S6K was not associated with PEM resistance. (A) Cells treated with or without rapamycin (3 μm) were further incubated with PEM as indicated and the viability was assayed with the WST assay. The bar graphs on the right showed relative viability that were calculated based on the absorbance of cells untreated or treated with rapamycin at 3 μm alone. Standard error bars are also shown (n = 3). (B) Western blot analysis of cells treated with rapamycin as indicated. Tubulin‐α was used as a loading control. (C) Cells treated with or without PF4708671 (20 μm) were further incubated with PEM as indicated and the viability was assayed with the WST assay. The bar graphs on the right showed relative viability that were calculated based on the absorbance of cells untreated or treated with PF4708671 at 20 μm alone. Standard error bars are also shown (n = 3). Standard error bars are also shown (n = 3). (D) Western blot analysis of cells treated with PF4708671 as indicated. Tubulin‐α was used as a loading control.
