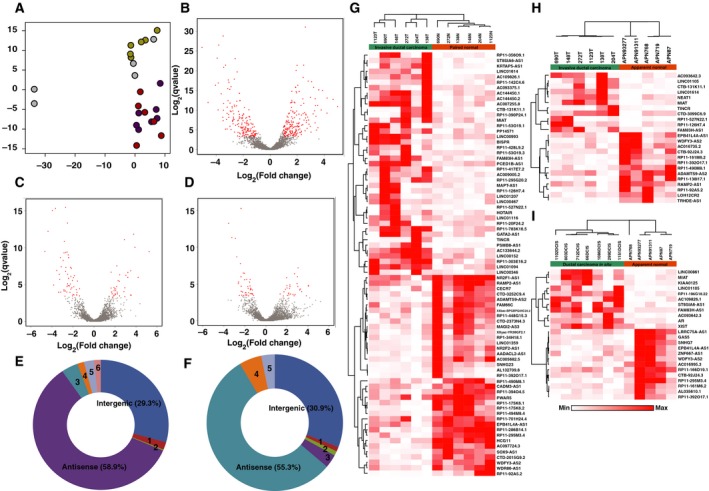
Figure 1.

Summary of DElncRNAs identified in DCIS and early‐stage breast cancer. (A) PCA based on lncRNA expression profile to demonstrate distinct segregation of tissues of various pathological types. Color legend: Apparent normal: yellow; DCIS: purple; Paired normal: green; IDC: red samples. (B) Volcano plot represents the expression pattern of lncRNA in IDC vs. paired normal samples. (C) Volcano plot represents the expression pattern of lncRNA in IDC vs. apparent normal samples. (D) Volcano plot represents the expression pattern of lncRNA in DCIS vs. apparent normal samples. (E) Pie chart representing DElncRNA subtypes in IDC vs. paired normal samples [1—intron overlapping (1.9%); 2—noncoding transcript (0.3%); 3—TEC (0.4%); 4—sense overlapping (1.5%); 5—processed transcript (2.4%); 6—completely intronic (1.6%)]. (F)Pie chart representing DElncRNA subtypes in IDC vs. apparent normal samples [1—intron overlapping (1.1%); 2—completely intronic (1.1%); 3—TEC (3.2%); 4—processed transcript (5.3%); 5—sense overlapping (3.2%)]. (G) Heatmap with supervised clustering represents the expression trend of DElncRNAs in IDC vs. paired normal samples. (H) Heatmap with supervised clustering represents the expression trend of DElncRNAs in IDC vs. apparent normal samples. (I) Heatmap with supervised clustering represents the expression trend of DElncRNAs in DCIS vs. apparent normal samples.
