Fig. 4.
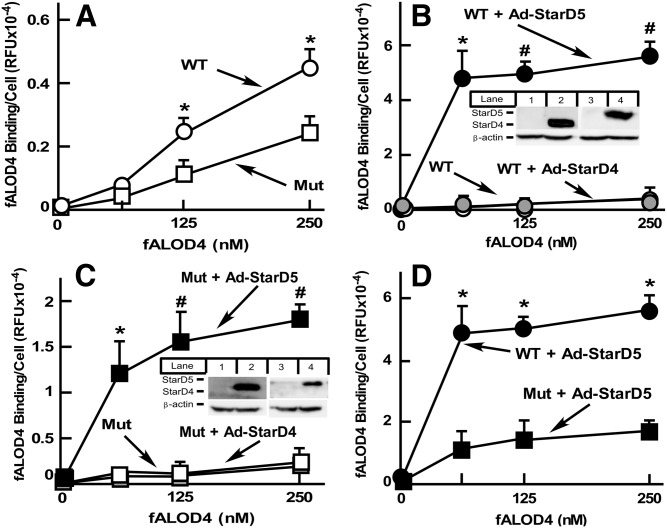
StarD5 overexpression results in higher accessible PM cholesterol in CHO cells. A: WT CHO and NPC1 10-3 mutant cells, grown in 10% FBS-containing F12 medium. Accessible PM cholesterol was quantified as described in the Materials and Methods (n = 3, *P < 0.005, WT cells versus NPC1 mutant cells). B: WT CHO cells, noninfected or infected with the indicated virus (3,000 MOI), were harvested, incubated with fALOD4, and fluorescent intensity was quantified as in A (n = 3, *P < 0.005, #P < 0.00005 WT cells infected with Ad-StarD5 versus noninfected or infected with Ad-StarD4). A portion of the cells were used to extract total cellular protein and quantify either StarD4 (lanes 1 and 2) or StarD5 (lanes 3 and 4) by Western blots to assess protein expression (insert). C: CHO NPC1 mutant 10-3 cells were used instead of WT CHO cells, as in B (n = 3, *P < 0.005, #P < 0.0005 NPC1 mutant cells infected with Ad-StarD5 versus WT noninfected or infected with Ad-StarD4). (D) Data from the StarD5-infected cells from B and C is plotted together to show the different response to StarD5 overexpression in accessible PM cholesterol of CHO WT versus NPC1 mutant 10-3 cells (n = 3, *P < 0.0005, WT cells versus NPC1 mutant cells infected with Ad-StarD5).

