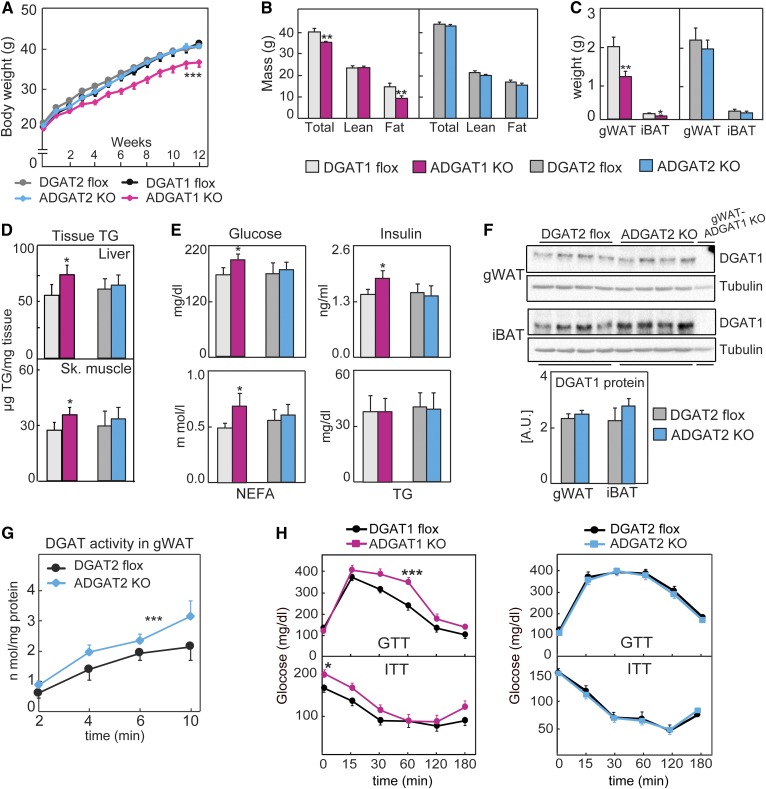
Fig. 3.
DGAT1 contributes more to diet-induced obesity than DGAT2. A: Body weights of mice fed an HFD (n = 15). B: Lean- and fat-mass analysis of mice fed an HFD (n = 10 per genotype). C: Weights of gWAT and iBAT of mice fed an HFD (n = 8). D: TG content of livers and skeletal muscle (n = 6 mice). E: Plasma parameters of mice fed an HFD (n = 6). F: Western blot analysis of tissues from mice fed an HFD (n = 4). G: Glucose- and insulin-tolerance tests were performed on mice fed an HFD (n = 10–16 per genotype). Data are presented as mean ± SD (C–E) or mean ± SEM (A, B, G, H). *P < 0.05, **P < 0.01 by t-test, and ***P < 0.001 by two-way ANOVA. iBAT, intrascapular brown adipose tissue; NEFA, nonesterified fatty acid.

