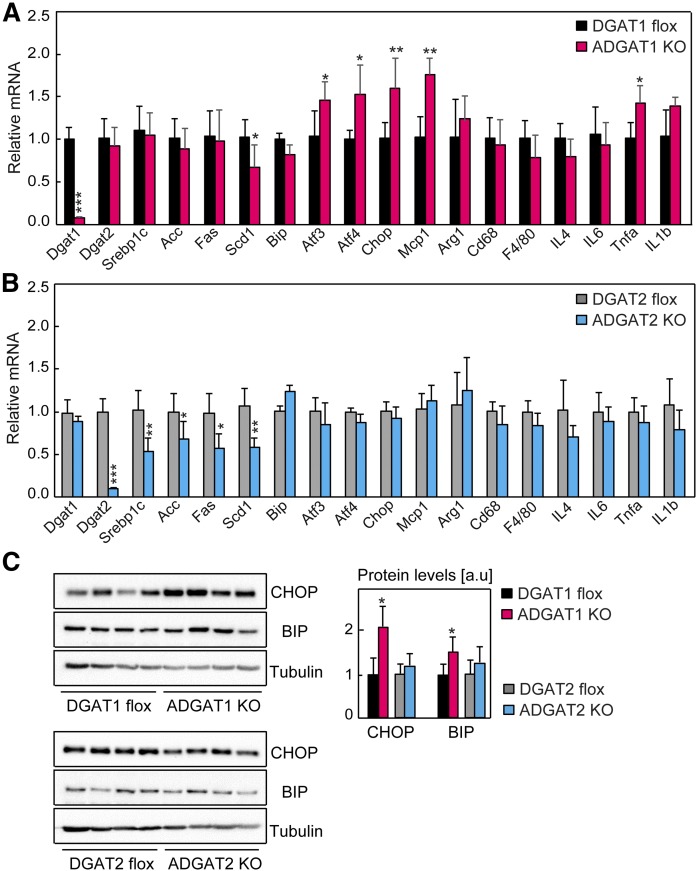
Fig. 4.
ER stress in ADGAT1 KO mice fed an HFD but not in ADGAT2 KO mice. A, B: mRNA levels of lipogenic genes, ER stress genes, and inflammatory genes determined by real-time qPCR (n = 6 mice per genotype). Mice were fed an HFD for 16 weeks. Tissues were collected in the ad libitum-fed state. C: Protein levels of BIP and CHOP in gWAT of mice fed an HFD for 16 weeks (n = 4). Data are presented as mean ± SD. *P < 0.05, **P < 0.01, and ***P < 0.001 by t-test.

