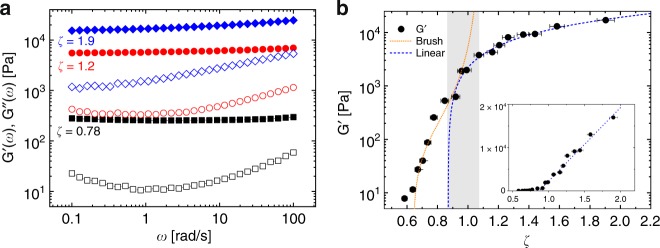
Fig. 3.
Oscillatory shear experiments on dense microgel suspensions. a G′(ω) (full symbols) and G″(ω) (open symbols) as a function of frequency ω for different packing fractions, ranging from marginally jammed to deeply overpacked. b G′(ω = 1.2 rad/s) as a function of packing fraction ζ fitted with the Brush model (orange dotted line) at lower ζ and with a linear function G′ = 17 kPa × (ζ − ζc), dashed line for ζ ≥ ζc = 0.87. The shaded area marks the crossover between the regime controlled by corona compression to the one governed by core–core interactions. Inset: Linear representation of the same data. The estimated error in ζ shown in panel (b) is ±3%

