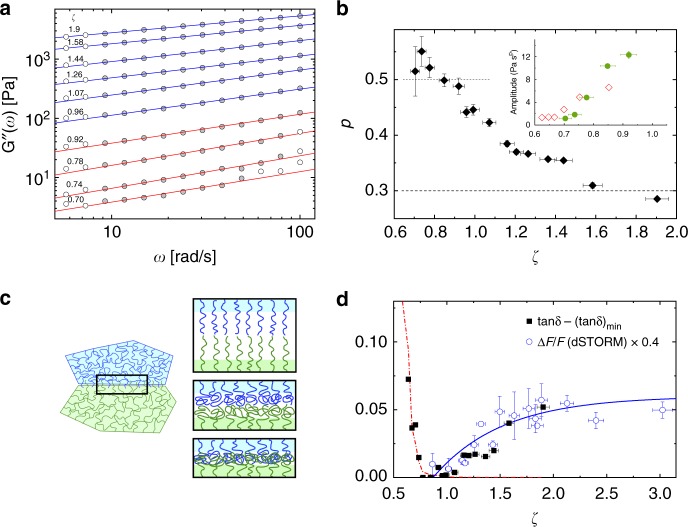
Fig. 4.
Loss modulus, interfacial lubrifiaction and friction in densely packed microgel suspensions. a Loss modulus G″(ω) for frequencies ω ≥ 4 rad/s for different packing fractions (symbols). Solid lines show the fit to the data with G″(ω) = A(ζ)ωp. Data points included in the fit range are filled dark gray. Lines with p ≃ 0.5 are red, p < 0.5 blue. b Values of p obtained by a best fit to the data. Inset: concentration dependence of A(ζ), ζ ≤ 0.92. Full symbols show the data for microgels, corresponding to the red lines in a, open symbols for emulsions (from ref. 56 with p ≡ 0.5). c Illustration of corona–corona interactions at the interface between microgels, see also Fig. 2. Initially the dangling corona polymer chains are extended in a brush-like configuration. At higher densities (ζ ~ ζc ~ 1) the chains are compressed. For ζ > ζc microgels interpenetrate. d Dissipative losses tanδ = G″/G′ at ω = 1.2 rad/s. Solid squares: tanδ − (tanδ)min with (tanδ)min = 0.043. Open circles: rescaled overlap area 0.4 × ΔF/F of adjacent microgels derived from dSTORM (see also Supplementary Fig. 5)37. Dash-dotted line denotes (1/G′) [arb.u.] and the solid line λ(1 − exp[−(ζ − ζc)/ξ]) with λ = 0.06 and ξ = 0.65 is a guide to the eye. The estimated error in setting ζ shown in panels b and d is ±3%

