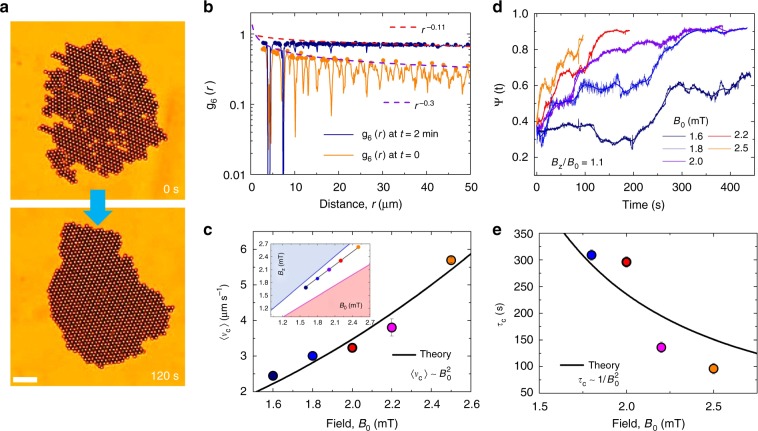
Fig. 3.
Annealing of magnetic carpet. a Experimental images showing an initial polycrystalline carpet (t = 0s, top) realized with an in-plane rotating field (B0 = 2.5 mT, f = 40 Hz), and a monocrystalline carpet obtained after t = 2 min of propulsion (B0 = 2.5 mT, Bz = 2.7 mT, f = 40 Hz). The scale bar is 20 μm, see Supplementary Movie 5 in the Supplementary Information. b Bond-orientational correlation functions g6(r) of the two carpets with superimposed corresponding peaks as solid disks and fits to an algebraic dependence as dashed lines. The exponent η6 can be used to distinguish the crystalline phase (η6 > 1/4) from the hexatic one3. c Average carpet speed 〈vc〉 vs. field amplitude B0 for different values of Bz. The continuous black line is a fit to the data using Eq. (16), with fixed parameters l = 3.2 μm, χ = 0.4, ω = 251.3 rads−1 and h = 2.6 μm. The small inset indicates the corresponding location of the experimental points in the diagram in Fig. 1g (B0∼Bz is taken). Error bars are obtained from the statistical average of different experiments. d Bond-orientational order parameter Ψ(t) vs. time t for different values of B0 (thus carpet speed vc). In the continuous lines in the graph is obtained by averaging the experimental data over a discrete time window. All experiments are conducted for carpets having a similar size of ~1000 particles. e Annealing time τc vs. field amplitude B0, with continuous black line is a fit to the data using Eq. (6)

