Fig. 1.
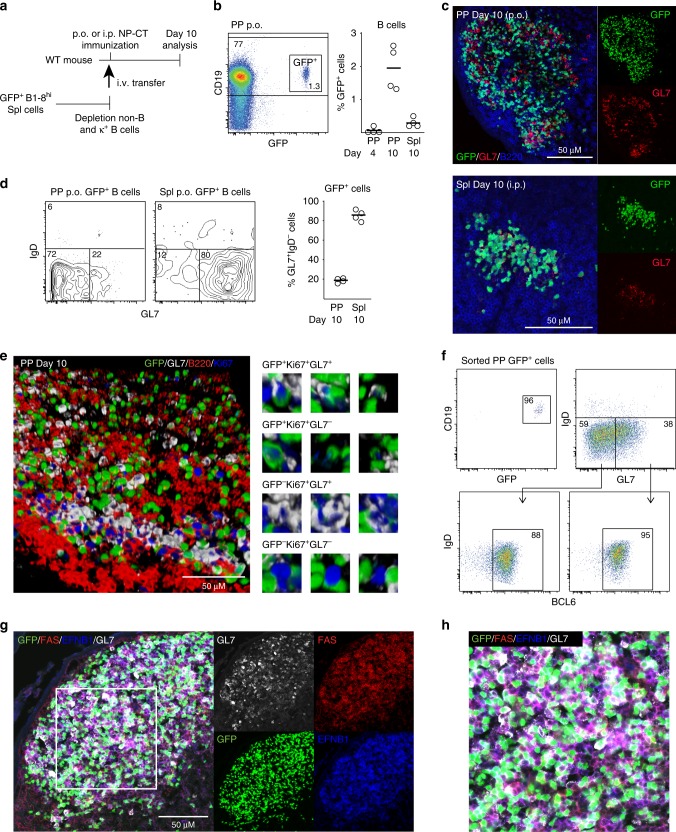
A majority of Peyer′s patch (PP) germinal center (GC) B cells lack expression of GL7. a A schematic depiction of the experimental model used to study specific B cell responses in the PP and spleen following per oral (p.o.) or intraperitoneal (i.p.) immunization. b Gating strategy and percentage of NP-specific GFP+ B cells of all CD19+ B cells in PP on day four and ten or in the spleen (Spl) on day ten after a single NP-CT p.o. or i.p. immunization. c Representative microscopy images of PP and spleen tissue sections showing GL7+ (red) and GL7− GFP+ (green) B220+ (blue) B cells in PP GC following immunization. d Flow cytometry contour graphs and percentage of GL7+ activated IgD− GFP+ B cells in PP and in the spleen on day ten following p.o. and i.p. immunizations, respectively. e 3D confocal microscopy image of a GC in PP with GL7+ (white) or GL7− proliferating Ki67+ (blue) GFP+ (green) B cells co-labeled for B220+ (red). Close-ups of different labeling patterns of activated NP-specific GFP+ or non-specific endogenous GFP- B cells in the GC image to the right. f A representative intracellular flow cytometry analysis of sorted GFP+ B cells of pooled PPs from two mice on day ten following oral immunization with NP-CT to assess the frequency of BCL6-expressing activated IgD− GL7+ or GL7− NP-specific B cells. g, h PP sections were labeled with FAS (red), EFNB1 (blue) and GL7 (white) to better show the demarcation of the GC reaction. Activated GFP+ B cells (green) are mostly within the GC borders while variably expressing GL7 (white). These are results from at least three independent experiments with 3–5 mice in each. Source data are provided as a Source Data file

