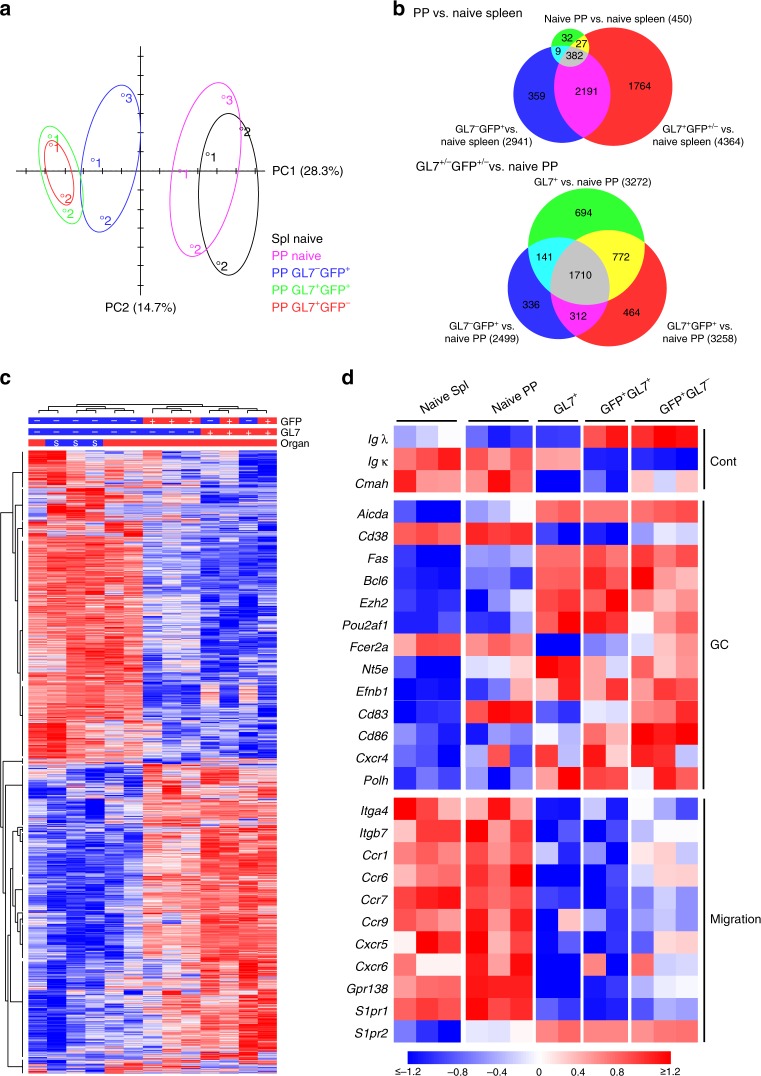
Fig. 3.
RNASeq analysis of GL7+ and GL7− antigen-specific Peyer’s patch (PP) B cells. a GFP+ antigen-specific B cells were sorted into GL7+ or GL7− populations on day ten following an oral immunization with NP-CT and their gene expression profiles were analyzed using RNAseq. Concomitantly GL7− (naïve) and GL7+ B cells from PP and GL7− B cells from the spleen of unimmunized control mice were sorted for a comparative analysis of gene expression profiles. A principle component analysis of RNAseq data demonstrated global gene expression similarities between GL7+ and GL7− GFP+ B cells that were distinctly different from GFP− naïve splenic or PP B cells, but similar to endogenous activated GFP− GL7+ GC B cells. b Venn diagrams comparing gene expression changes between groups. In the upper panel, naïve GL7− (n = 3 samples), activated PP GFP+GL7− (n = 3) and activated GFP+/−GL7+ PP (n = 4) PP B cells were compared to GL7− naïve splenic B cells (n = 3), and in the lower panel activated PP GFP+GL7− (n = 3), GFP+GL7+ PP (n = 2) and GFP−GL7+ PP (n = 2) were compared to naïve GL7− PP B cells (n = 3). Genes with a fold change > 1.5 and FDR adjusted p-value < 0.05 were counted, and the figures in each Venn field indicate the number of shared genes between groups. c Heat map of global gene expression in the PP B cell subpopulations compared to that of sorted naïve splenic B cells. d Heat map depicting the mRNA expression of selected genes in different B cell subpopulations, demonstrating differences between GL7+ and GL7− NP-specific GFP+ B cells with regard to gene expression signatures associated with migratory cues but similarities in expression of GC genes. Differences in gene expression are indicated the same in c and d with the scale at the bottom being applicable to both

