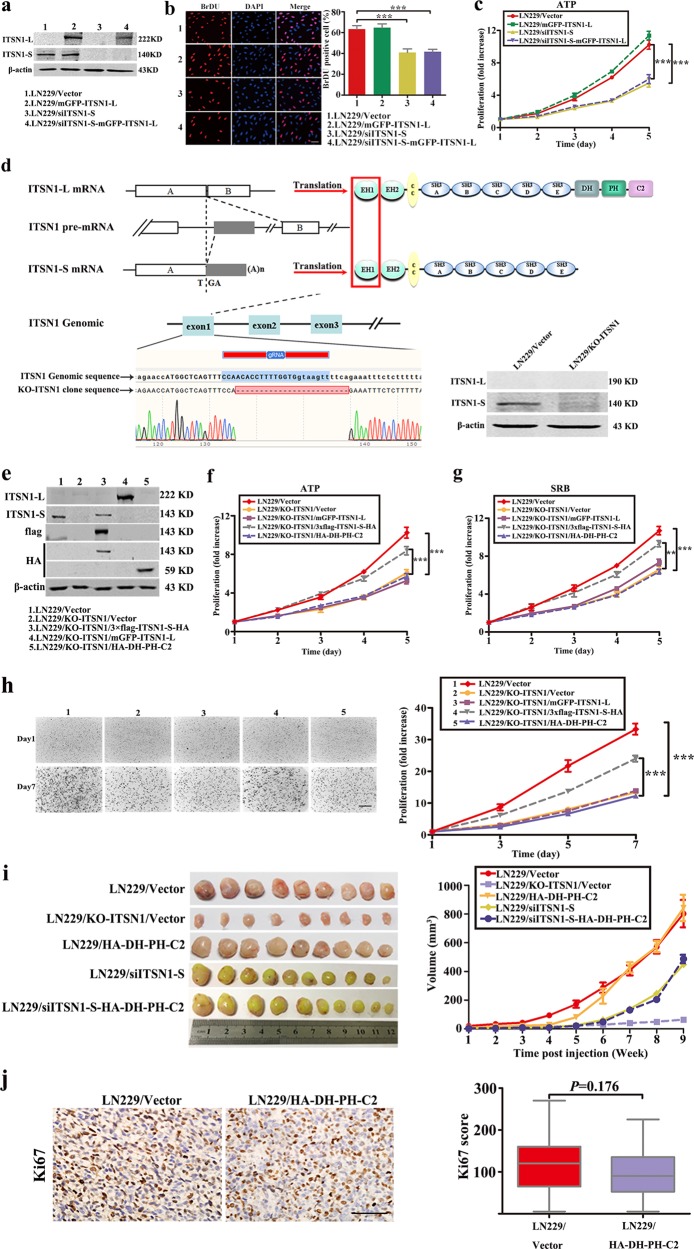
Fig. 2. Intersectin1 (ITSN1)-L did not affect proliferation in glioma cells.
a LN229 cells stably infected with lentivirus containing ITSN1-S shRNA sequences or full-length ITSN1-L were lysed and analyzed by western blot. β-Actin was used as loading control. b 5-Bromo-2-deoxyuridine assay was used to detect cell proliferation ability. c Proliferation ability was examined by ATP/viability assay. Scale bars, 50 μm. d Generation of two isoforms of human ITSN1 gene knockout LN229 cells. It showed ITSN1 two isoforms generated by alternative splicing of last exon of ITSN1-S. To knockout ITSN1 two isoforms, we designed gRNA in exon1, which is the common region of two isoforms (line 4). Both sequencing and western blot confirmed the knockout of ITSN1 expression. e ITSN1 knockout cells stably infected with lentiviruses of vector, 3×flag-ITSN1-S-HA, mGFP-ITSN1-L, and HA-DH-PH-C2, respectively, were lysed and analyzed by western blot to assess protein levels. f, g Proliferation ability was examined by ATP/viability assay (f) and Sulforhodamine B assay (g). h Three-dimensional proliferation assay was performed in the indicated cells. Colonies were stained with neutral red after different time points of growth and then photographed (×4) and analyzed using the Scion image analysis system. Scale bars, 500 μm. i Subcutaneous mouse xenograft models were performed in vivo. Sixty Nu/Nu mice were used and divided into five groups. The size of xenograft tumors was measured each week. The representative images of tumor size of each group were captured after sacrificed. Quantitative results of in vivo assay were analyzed in the right panel. j The expression pattern of Ki67 was detected in paraffin section by immunohistochemical analysis. Scale bars, 100 μm. Values were expressed as mean ± SD from three independent experiments (Student’s t test, **P < 0.01, ***P < 0.001)

