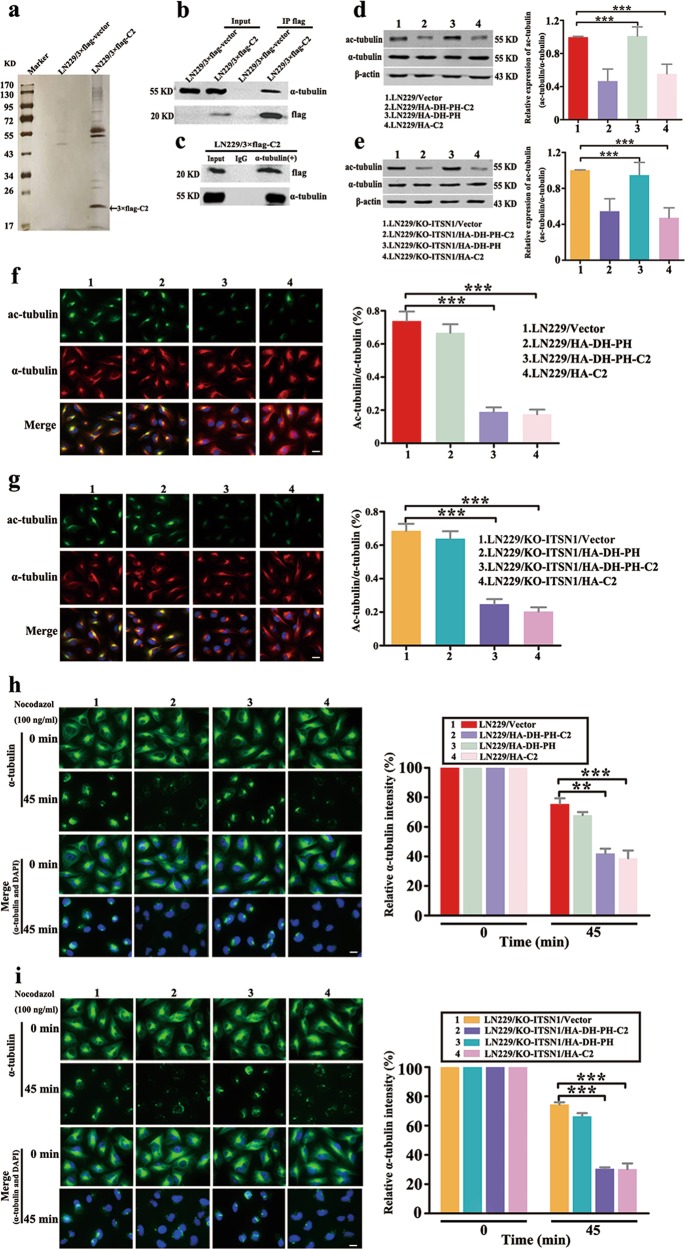
Fig. 4. C2 domain of intersectin1 (ITSN1)-L interacted with α-tubulin and disturbed stable cytoskeletal microtubules.
a Mass spectrometric analysis of 3×flag-C2-associated proteins. Cellular extracts were immunopurified with anti-flag M2 gel and eluted with flag peptides. The eluates were resolved by sodium dodecyl sulfate–polyacrylamide gel electrophoresis, silver-stained, and analyzed by mass spectrometry. b Immunoprecipitation (IP) was performed with anti-flag M2 affinity gel followed by immunoblotting with antibodies against flag and α-tubulin. c IP was performed by using antibodies anti-α-tubulin or control IgG followed by western blot. d, e Expression of ac-tubulin and α-tubulin was determined by western blot analysis in LN229 cells (d) and LN229/KO-ITSN1 cells (e). The relative ratio of ac-tubulin (ac-tubulin/α-tubulin) was measured by Gray analysis of the western blot data. f, g Representative immunofluorescent images of ac-tubulin and α-tubulin expression in LN229 cells (f) and LN229/KO-ITSN1 cells (g). Nuclei were stained with 4,6-diamidino-2-phenylindole. The fluorescence intensities of ac-tubulin and α-tubulin were quantified using the ImageJ software. h, i Images of microtubule stability in LN229 cells (h) and LN229/KO-ITSN1 cells (i) by using nocodazole (100 ng/ml) treated for 45 min and stained with anti-α-tubulin antibody. The fluorescence intensity of the remaining microtubules was measured. Values were expressed as mean ± SD from three independent experiments (two-way analysis of variance, **P < 0.01, ***P < 0.001). Scale bars, 20 μm

