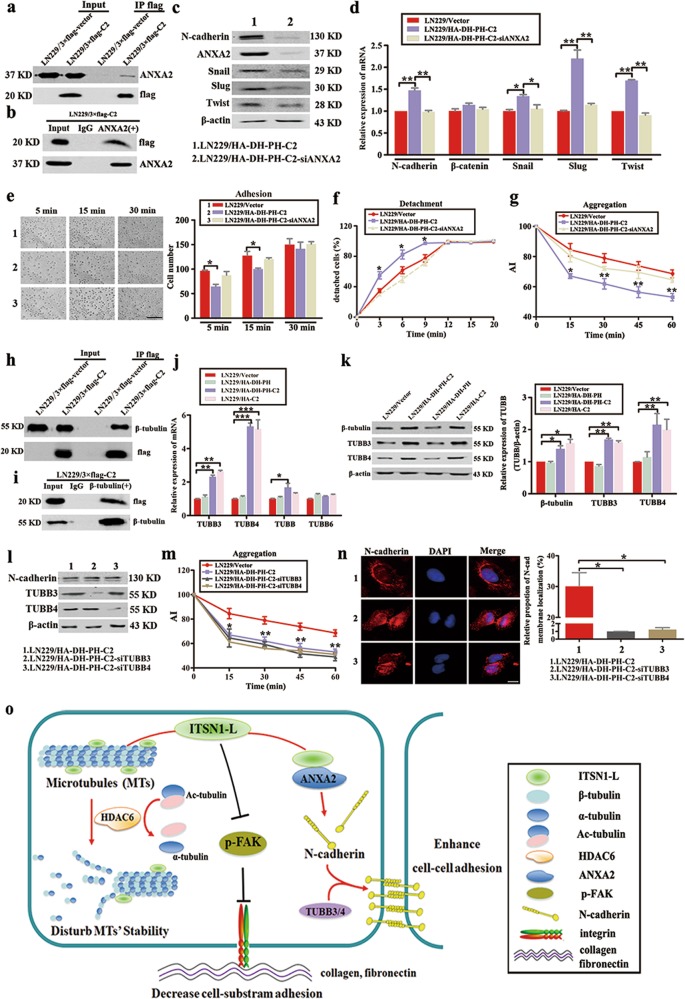
Fig. 7. C2 domain of intersectin1 (ITSN1)-L upregulated N-cadherin expression and translocation by ANXA2 and TUBB3/TUBB4.
a Immunoprecipitation (IP) was performed by using an anti-flag M2 affinity gel. Expression of flag-tagged C2 domain of ITSN1-L and ANXA2 was determined by western blot. b IP was performed by using antibodies against ANXA2 or control IgG. Expression of β-tubulin and C2 domain was determined by western blot analysis. c ANXA2 reduction cells were lysed and tested the expression of N-cadherin, Snail, Slug, and Twist by western blot. β-Actin was used as a loading control. d Total RNAs were prepared and mRNA levels of the indicated genes were examined by quantitative real-time PCR (qRT-PCR). The levels of mRNA were normalized against that of GAPDH. e Adhesion ability to substrate of the indicated cells were imaged (left panel) and counted (right panel) at 5, 15, and 30 min, respectively. Scale bars, 200 μm. f, g Detachment assay (f) and aggregation assay (g) results of the indicated cells. h IP was performed with anti-flag M2 affinity gel followed by immunoblotting with antibodies against β-tubulin and flag. i IP was performed by using anti-β-tubulin antibody followed by western blot. j qRT-PCR analysis to measure the mRNA expression of TUBBs. k Western blot tested the expression of β-tubulin, TUBB3, and TUBB4 in different fragments of ITSN1-L-overexpressing cells. l Cells were treated with the indicated siRNA, and the efficiency of knockdown and N-cadherin expression were examined by western blot. β-Actin was loaded as a control. m Aggregation assay results of the indicated cells. n Immunofluorescence assay was used to test the distribution of N-cadherin after TUBB3 or TUBB4 reduction. Analysis of surface localization of N-cadherin is shown in right panel. Scale bars, 20 μm. Values were expressed as mean ± SD from three independent experiments (Student’s t test, *P < 0.05, **P < 0.01, ***P < 0.001). o A proposed schematic model of the ITSN1-L function in cell motility

