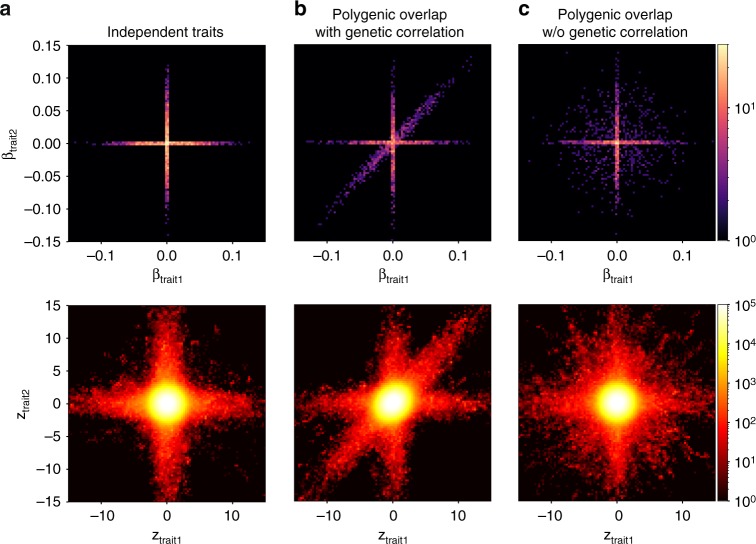
Fig. 1.
Components of the bivariate mixture in three scenarios of polygenic overlap. All figures are generated from synthetic data, where causal variants were drawn from the MiXeR model, the total polygenicity in each trait is set to 0.01%, SNP heritability is set to 0.4, GWAS N = 100,000. First column shows two traits where causal variants do not overlap. Second column adds a component of causal variants affecting both traits in the same (concordant) direction. Third column shows a scenario of polygenic overlap without genetic correlation. Top row shows simulated bivariate density of additive effects of allele substitution (β1j, β2j), the bottom row shows bivariate density of GWAS signed test statistics (z1j, z2j) for GWAS SNPs (genotyped or imputed). Due to linkage disequilibrium, GWAS-signed test statistic has substantially larger volume of SNPs associated with the phenotype. The aim of the MiXeR model is to infer distribution of causal effects (top row), using GWAS data (bottom row) as an input. Figures are generated on a regular grid of 100 × 100 bins, color histogram indicates log10(N) where N is the number of SNPs projected into a bin

