
Fig. 3.
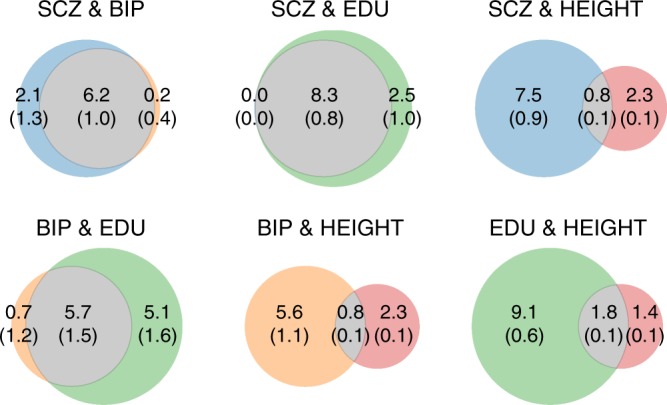
Venn diagrams of unique and shared polygenic components at the causal level, showing polygenic overlap (gray) between schizophrenia (SCZ, blue), bipolar disorder (BIP, orange), educational attainment (EDU, green), and height (red). The numbers indicate the estimated quantity of causal variants (in thousands) per component, explaining 90% of SNP heritability in each phenotype, followed by the standard error. The size of the circles reflects the degree of polygenicity