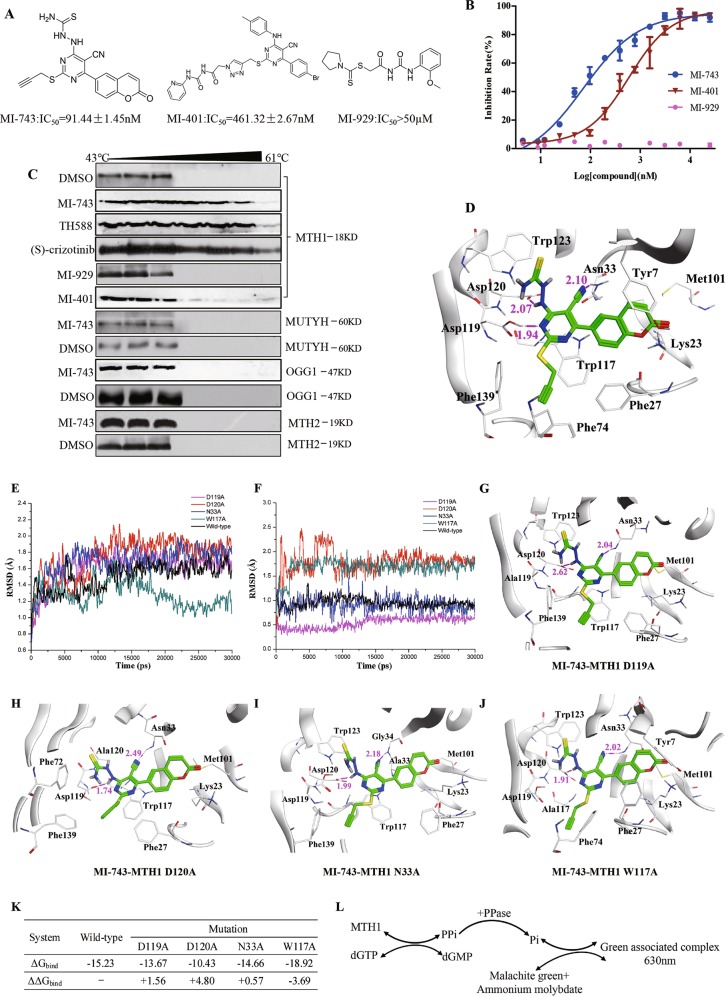
Fig. 2. Screening of MTH1 inhibitors in vitro, MD simulations and binding free energy calculation of compound MI-743 and MTH1.
a The structures, IC50 values and (b) percentage of MTH1 inhibition rate of the potential inhibitors MI-743, MI-401 and negative compound MI-929. c MGC-803 cells were treated with 50 µM compounds MI-743, MI-401, (S)-crizotinib or MI-929, respectively, collected and heated for 10 min from 43 to 61 °C. The cells were lysed and the protein levels of MTH1, OGG1, MUTYH or MTH2 were determined by western Blot. At least three independent experiments were performed for each group. Data are presented as means ± SD. d Predicted binding mode of compound MI-743 in MTH1 binding pocket (PDB code: 4N1U). Compound MI-743 is shown as green stick. The residues of MTH1 associated with MI-743 are shown in white. Hydrogen bonds are shown in magenta dash lines and the corresponding distances are given in Å. The RMSD value plots of the protein (MTH1) (e) and ligand (MI-743) (f) in the mutation and wild-type complex systems after 30 ns MD simulations. Binding models of compound MI-743 in MTH1 D119A (g), D120A (h), N33A (i) and W117A (j) mutations. k MM/PBSA binding free energy, estimated with the MTH1 wild-type and mutant systems obtained from the last 5 ns stable MD trajectory. l Flow diagram for the principle of detecting MTH1 activity. Since MTH1 can convert dGTP to dGMP and pyrophosphate, and the latter of which can be hydrolyzed to inorganic pyrophosphate by inorganic pyrophosphatase, the formed inorganic pyrophosphate can react with malachite green and ammonium molybdate to produce the green associated complex, the absorbance of which can be measured at 630 nm by PerkinElmer Envision microplate reader, indicating the activity of MTH1

