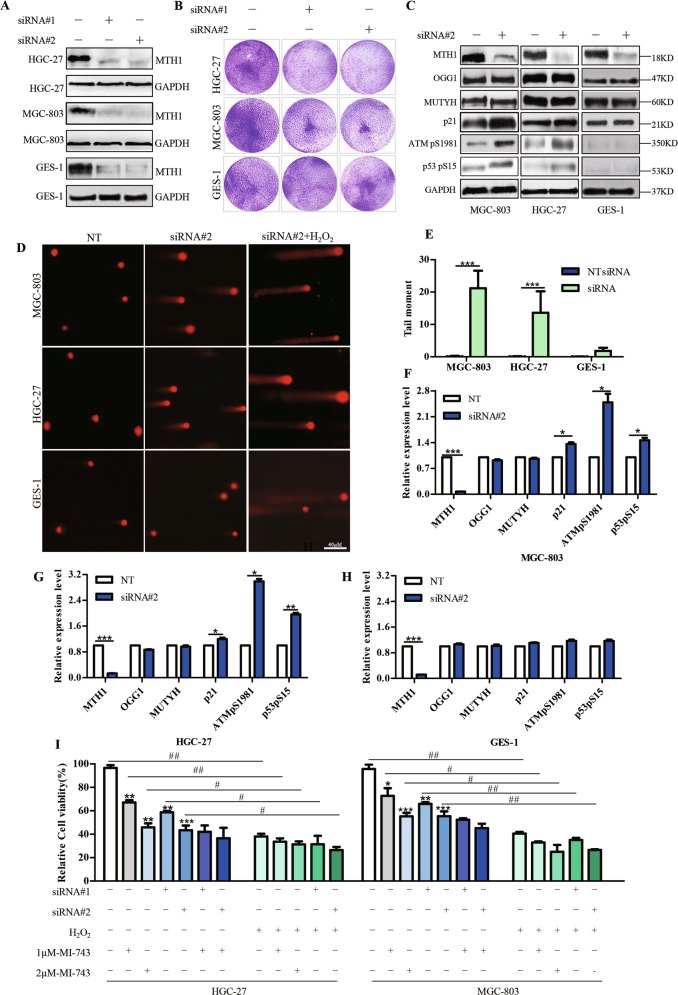
Fig. 7. MTH1 suppression reduces the two gastric cancer cell survival.
MGC-803, HGC-27 and GES-1 cells were treated by MTH1 specific siRNA#1 and #2 for 72 h. Non-targeting siRNA(NT) treatment was used as control. a Levels of MTH1 protein then were determined by western blot. b The colony formations were recorded after the cells were treated with MTH1 siRNA#1 and #2 for 7 days. c Western Blot analysis of the protein levels of MTH1, MUTYH, OGG1, p21, ATMpS1981 and p53pS15, after the cells were treated with siRNA#2. f–h Densitometry shows relative protein expression normalized by GAPDH. d The Alkaline comets assay was performed after the cells were transfected with MTH1 siRNA#2 for 72 h. Pictures were originally captured at ×40 magnification by fluorescence microscope. Non-targeting siRNA(NT) or H2O2 treatment was used as a negative or a positive control, respectively. e Tail moment was calculated by CometScore software. Three individual experiments were performed for each group. i Relative cell viability was determined by MTT assay, after the cells were treated with MTH1 siRNA#1 and #2 with or without MI-743 combined with 100uM H2O2. Data are presented as means ± SD. Three individual experiments were performed for each group. The symbols * and #, ** and ## or ***and ### stand for P < 0.05, P < 0.01 or P < 0.001 compared with the controls

