Fig. 2.
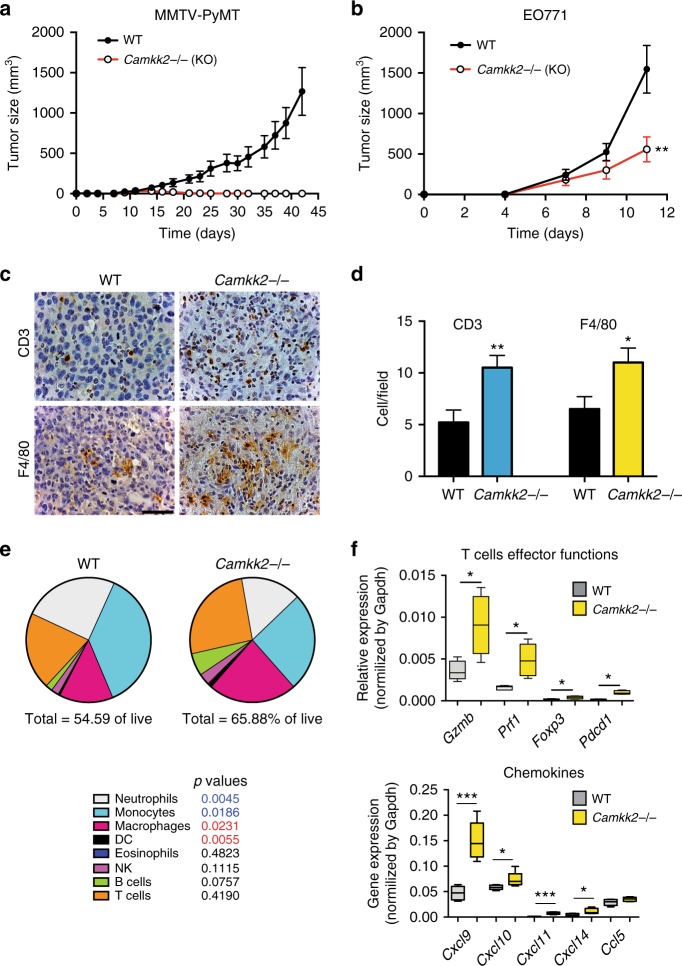
The growth of mammary tumors is attenuated in mice lacking CaMKK2. a Mammary tumors from MMTV-PyMT mice propagated in a C57BL/6 background were harvested, diced, and orthotopically grafted into syngeneic C57BL/6 mice that were WT or knockout for Camkk2 (WT and Camkk2−/−, respectively; mean ± SEM; N = 10 in each group). b Murine E0771 cells (4 × 10⁵ cells/mouse) were orthotopically grafted in WT and Camkk2−/− mice, and subsequent tumor volume measured as indicated (N = 5 in each group; this experiment was replicated with a comparable number of mice at least three times). A two-way ANOVA test was used to calculate p-values. c Representative images of E0771 tumors from WT and Camkk2−/− mice. Sections were stained with anti-CD3 or anti-F4/80 antibodies (scale bar = 50 μm). d Quantitation of CD3+ and F4/80+ cells in high-power optic (×400 magnification) fields in stained sections (six fields for each section; N = 3 individual tumors in each group). Bar graph reports the mean ± SEM. N = 18 data points/genotype. *p < 0.05, **p < 0.01, respectively. A t test was used to calculate p-values. e E0771 tumors of comparable size (500–700 mm3) were removed from WT and Camkk2−/− mice, digested with collagenase and DNase I to obtain a single-cell suspension. Immune cells were identified by flow cytometry, according to the gating strategy reported in Supplementary Fig. 2C. Pie charts show the mean percentages of immune cell subsets detected in tumors removed from WT and Camkk2−/−. Values reported under each pie chart refer to the percentages of tumor-infiltrating CD45+ cells. N = 8 and 4 tumors from WT and Camkk2−/− mice were analyzed. A t test was used to calculate statistical significance. p-values color code: blue and red values indicate a statistically significant increase or decrease of the indicated cell types in tumors from WT compared with KO host, respectively. f Gene expression analysis in E0771 tumors removed from WT and Camkk2−/− mice (N = 5 and 5, respectively). A t test was used to calculate p-values. Bar graph reports the mean ± SEM. *p < 0.05, ***p < 0.005

