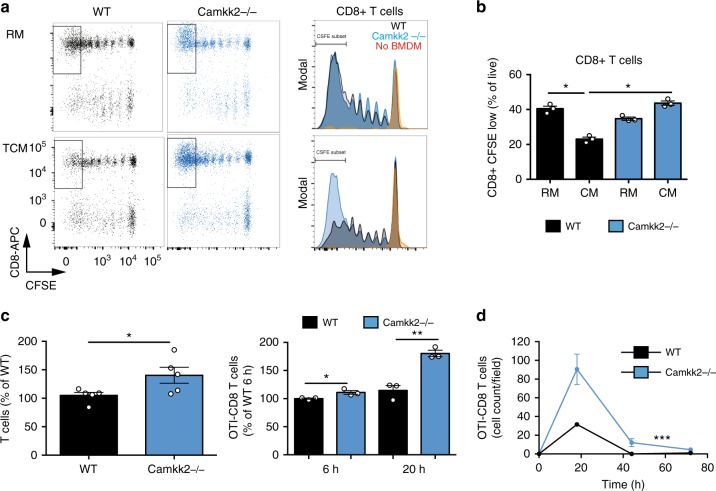
Fig. 7.
CaMKK2 mediates the immune-stimulatory ability of BMDM generated in tumor-conditioned medium. a CFSE-labeled T cells isolated from wild-type mice were cultured with anti-CD3 antibody, in the presence or absence of WT or Camkk2−/− BMDM generated in regular medium or the tumor-conditioned medium (RM and TCM, respectively). Dot plots and histograms of T cells recovered after co-culture for 72 h (Left and right, respectively). T cells were identified according to the gating strategy reported in the Supplementary Fig. 3A. b Percentage of CFSE-low CD8+ T cells (gate is displayed in the panel A dot plots). N = 3 biological replicates for each genotype. t test was used to calculate p-values. The experiment was replicated with similar results. c BMDM were generated from WT and Camkk2−/− mice (WT and KO, respectively) in the presence of TCM. After 5 days of culture, BMDM supernates were collected and tested in a chemotaxis transwell assay for the ability to recruit T cells isolated from lymph nodes of WT mice or CD8+ OTI T cells (left and right panels, respectively). Bar graphs report mean ± SEM of T cells migrating toward BMDM supernates after 12 h and percentages of CD8 + OTI T cells migrating toward BMDM supernates at 6 and 12 h (mean ±SEM; N = 3 replicates for each genotype). t test was used to calculate p-values. These experiments were replicated with similar results. d A 3D microfluidic tumor on-a-chip model was used to test the effects of BMDM in E0771 tumor microenvironment (schematic of 3D on-chip model is shown in Supplementary Fig. 9). Graph reports kinetics of OTI CD8+ T cells migrating toward 3D E0771-microenvironment infiltrated by WT or Camkk2−/− BMDM (mean± SEM; N = 3 low magnification fields). Two-way ANOVA was used to calculate p-values. Asterisks refer to *p < 0.05, **p < 0.01, ***p < 0.005, and ****p < 0.001, respectively

