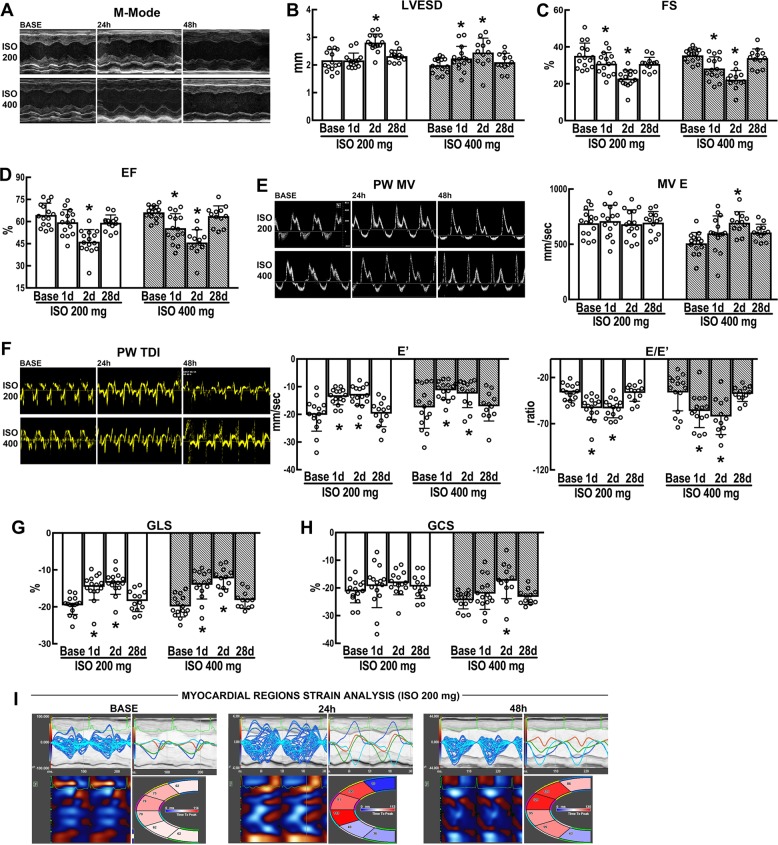
Fig. 2. Isoproterenol transiently impairs cardiac function.
a Representative M-mode tracing at Base, 1 day and 2 days after a single s.c. injection of Isoproterenol (ISO) at 200 or 400 mg/Kg. b–d Cumulative data of cardiac dimensions and function at the different time points. LVESD = left ventricular end-systolic diameter (b), FS = fractional shortening (c), and EF = ejection fraction (d). b, d *p < 0.05 vs. Base, 1d and 28d in ISO 200 mg; *p < 0.05 vs. Base and 28d in ISO 400 mg (one-way ANOVA analysis with Tukey’s multiple comparison test). c *p < 0.05 vs. Base and 28d in ISO 200 mg and *p < 0.05 vs. Base and 28d in ISO 400 mg (one-way ANOVA analysis with Tukey’s multiple comparison test). e Representative pulsed wave Doppler Mitral Velocity tracing (PW MV, left) and cumulative transmitral Doppler early filling velocity (MV E data, right) at Base, 1d and 2d after a single s.c. injection of ISO at 200 or 400 mg/Kg. *p < 0.05 vs. Base, 1d, and 28d in ISO 400 mg (one-way ANOVA analysis with Tukey’s multiple comparison test). f Representative pulsed wave tissue Doppler imaging velocity tracing (PW TDI, left) and cumulative early diastolic mitral annular velocity value (E’, mid) and E/E’ ratio (right) data at Base, 1d and 2d after a single s.c. injection of ISO at 200 or 400 mg/Kg. *p < 0.05 vs. Base and 28d in ISO 200 mg and *p < 0.05 vs. Base and 28d in ISO 400 mg (one-way ANOVA analysis with Tukey’s multiple comparison test). g, h Cumulative data of global longitudinal and circumferential strain (GLS and GCS, respectively) at the different time points at Base, 1d and 2d after a single s.c. injection of ISO at 200 or 400 mg/Kg. g *p < 0.05 vs. Base and 28d in ISO 200 mg and *p < 0.05 vs. Base and 28d in ISO 400 mg (one-way ANOVA analysis with Tukey’s multiple comparison test). h *p < 0.05 vs. Base, 1d, and 28d in ISO 400 mg (one-way ANOVA analysis with Tukey’s multiple comparison test). i Representative images of regional speckle-tracking strain analysis throughout four segments (apical, anterior and inferior segments wall, and mid-anterior and inferior wall) at Base, 1d and 2d after a single s.c. injection of ISO at 200 mg/Kg. n= 15 (ISO 200 mg/Kg, BASE, 1d, and 2d); n = 13 (ISO 200 mg/Kg, 28d); n = 15 (ISO 400 mg/Kg, BASE and 1d); n = 12 (ISO 400 mg/Kg, 2d, and 28d). All data are mean ± SD

