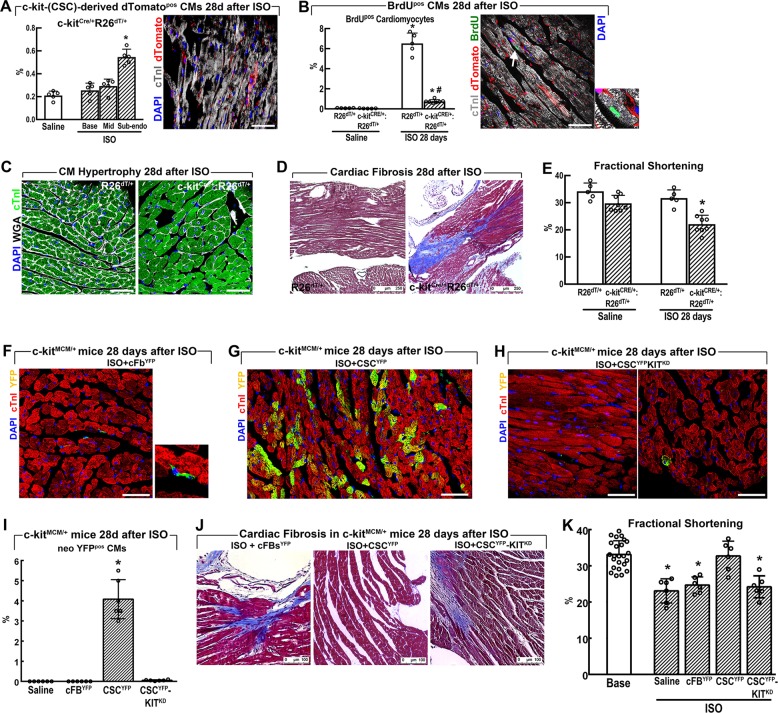
Fig. 6. Wild-type c-kitpos CSCs rescue the regenerative defect of c-kitCre mice after injury in vivo.
a Bar graph with cumulative data showing the number of dTomatopos myocytes in saline (n = 5) and ISO (n = 5) injected c-kitCre/+:R26dT/+ mice 28 days after treatment. *p < 0.05 vs. all (one-way ANOVA analysis with Tukey’s multiple comparison test). Right, representative confocal image showing dTomatopos CMs in c-kitCre/+:R26dT/+ mice. b Bar graph with cumulative data shows that 28 days post-ISO, the number of newly generated BrdUpos myocytes was significantly less in c-kitCre/+:R26dT/+ (n = 7) compared with R26dT/+ mice (n = 5). p < 0,05 vs. Saline; #p < 0,05 vs. R26dT/+ mice (one-way ANOVA analysis with Tukey’s multiple comparison test). Right, representative confocal image showing BrdUpos CM in c-kitCre/+:R26dT/+ mice 28 days after ISO. c Representative confocal images of cardiac cross-section showing cardiomyocyte hypertrophy in c-kitCre/+:R26dT/+ mice when compared with R26dT/+ mice (WGA, wheat germ agglutinin, Cy5 staining, and white fluorescence; cTnI, green; DAPI, blue nuclei). d Representative Masson’s trichrome staining of cardiac cross-sections from c-kitCre/+:R26dT/+ mice 28 after ISO showing multiple areas of replacement fibrosis compared with R26dT/+ mice. Scale bar = 250 μm. e Cardiac function 28 days after ISO as assessed by Echocardiography is depressed in c-kitCre/+:R26dT/+ (n = 8) when compared with R26dT/+ mice (n = 5). *p < 0.05 vs. all (one-way ANOVA analysis with Tukey’s multiple comparison test). f Representative confocal microscopy image showing the absence of YFPpos CMs in cardiac Fibroblasts (cFbYFP)-injected c-kitMCM/+ mice (right insert, 3× zoom, shows the rare detection of YFPpos interstitial non-CM cells) in the apical sub-endocardium 28 days after ISO injury. Scale bar = 50 µm. g Robust replacement of YFPpos CMs in CSCYFP-injected c-kitMCM/+ mice in the apical sub-endocardium 28 days after ISO injury. Scale bar = 50 µm. h The two representative confocal images show the very minimal number of YFPpos CMs (only visible in the right panel) in CSCYFP-KITKD(c-kit knock-down by specific stealth RNAi siRNA transfection)-injected c-kitMCM/+ mice in the apical sub-endocardium 28 days after ISO injury where most of the engrafted cells remained as interstitial non-CM cells. Scale bar = 50 µm. i Bar graph with cumulative data showing the number of YFPpos cardiomyocytes (CMs) in injured c-kitMCM/+ mice injected with saline (n = 5), CSCYFP (n = 5), or CSCYFP-KITKD (n = 5) injected c-kitCre/+:R26dT/+ mice 28 days after ISO. *p < 0.05 vs. all (one-way ANOVA analysis with Tukey’s multiple comparison test). j Representative Masson’s Trichrome staining showing the presence of cardiac fibrosis in c-kitMCM/+ mice 28 days after ISO injected with cFBsYFP or CSCYFP-KITKD that is absent in c-kitMCM/+ mice transplanted with CSCYFP. Scale bar = 100 μm. k Cumulative data showing Fractional Shortening as assessed by Echocardiography in c-kitMCM/+ mice at baseline and 28 days after ISO plus Saline or cFBsYFP or CSCYFP CSCYFP-KITKD. n = 6 per group, p < 0.05 vs. Base and CSCYFP (one-way ANOVA analysis with Tukey’s multiple comparison test). Scale bars = 50 µm unless differently specified in the panels. All data are mean ± SD

