
Figure 2.
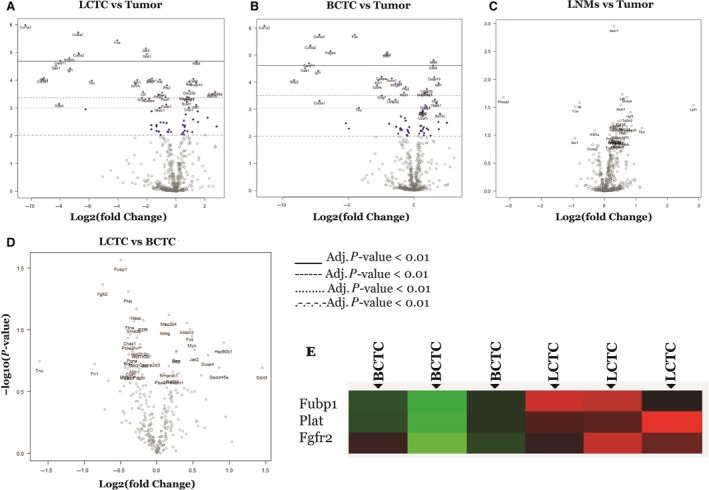
Volcano plot displaying differentially expressed genes between LCTC, BCTC, and LNMs (using the primary tumor as reference). The y‐axis corresponds to the mean expression value of log10 (P‐value), and x‐axis displays the log2‐fold change value. Highly statistically significant genes appear at the top of the plot above the horizontal lines (various P‐values threshold indicated): P < 0.05, P,.01, P < 0.5, and highly differentially expressed genes are plotted at either side of zero. Genes were considered significant as indicated in the figure. Only genes in significant range are colored and named. The 40 most statistically significant genes of LCTCs vs. primary tumor are shown in (A), BCTCs vs. primary tumor are shown in (B), LMNs vs. primary tumor are shown in (C), and LCTCs vs. BCTCs are shown in (D) are labeled in the plot. (E) Differentially expressed genes between LCTC and BCTC. Green = overexpressed gene; Red = underexpressed genes; black = no change in expression.