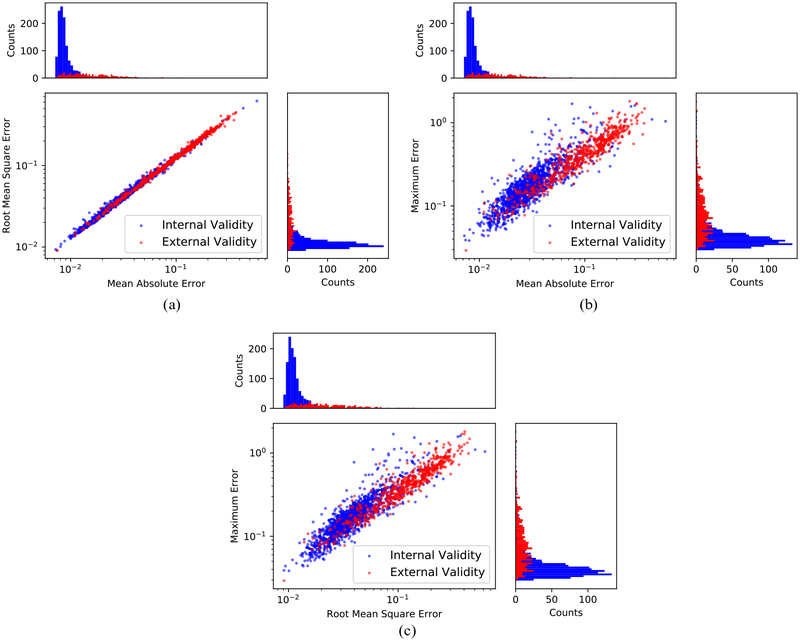
Figure 5.
Illustration of the LSTM model’s predictive performance on the internal validity dataset and the external validity dataset using MAEs, RMSEs and MEs metrics. The histograms of each metric were inserted next to the axes of each subplot. The internal validity patient data was plotted in blue, and the external validity patient data was plotted in red. (a) Distributions and histograms of MAE and RMSE values for all patients. (b) Distributions and histograms of MAE and ME values for all patients. (c) Distributions and histograms of RMSE and ME values for all patients.

