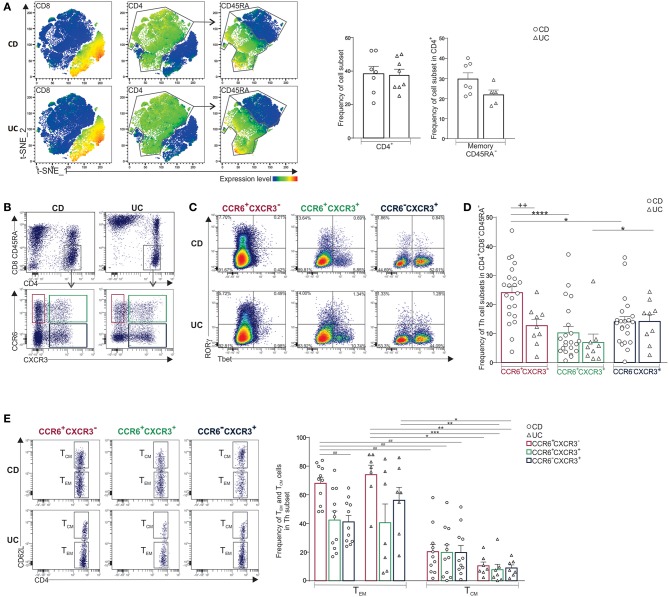
Figure 1.
Predominance of CCR6+CXCR3-CD4+ T cells in mLNs of CD when compared to UC patients. (A) CD3+ T cells isolated from mLNs of CD and UC patients were concatenated for t-SNE analysis. Feature plots of the indicated antigens (left panels). Frequencies of CD4+ and memory CD45RA− T cells (right panels). (B) Representative dot plots of CCR6+CXCR3−, CCR6+CXCR3+ and CCR6−CXCR3+ CD4+ subsets, (C) their expression of RORγ and Tbet, and (D) frequencies of indicated Th subsets. (E) Representative dot plots and frequencies of TEM (CD62Llow) and TCM (CD62Lhigh) among Th subsets. Unpaired t-test (+), Friedmann test followed by Dunn's test (*) and repeated measures one-way ANOVA followed by Tukey's test (#). *P < 0.05, **++##P < 0.01, and ***P < 0.001, ****P < 0.0001.

