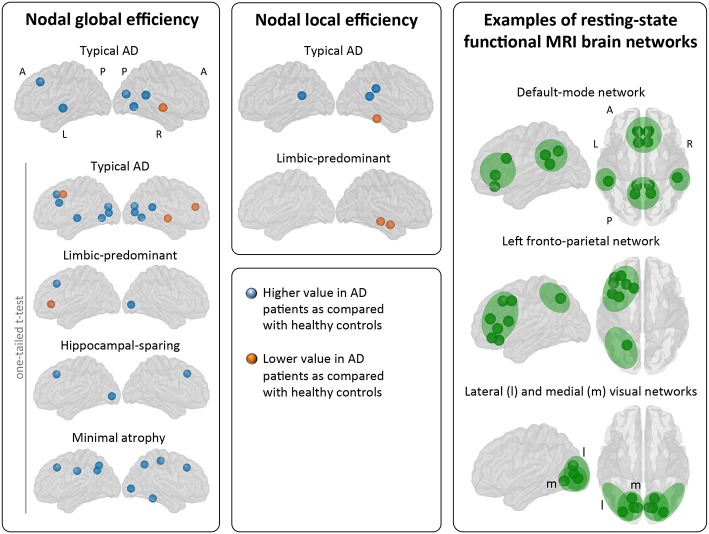
Figure 5.
Comparison of the AD subtypes with the healthy controls in nodal network measures. The right box shows examples of resting-state functional MRI brain networks for interpretation of the nodal results obtained in the current study. Our graph nodes were assigned to the default-mode, fronto-parietal, and visual networks according to a previous review (52). AD, Alzheimer's disease; A, anterior; l, lateral; L, left; m, medial; MRI, magnetic resonance imaging; P, posterior; R, right.

