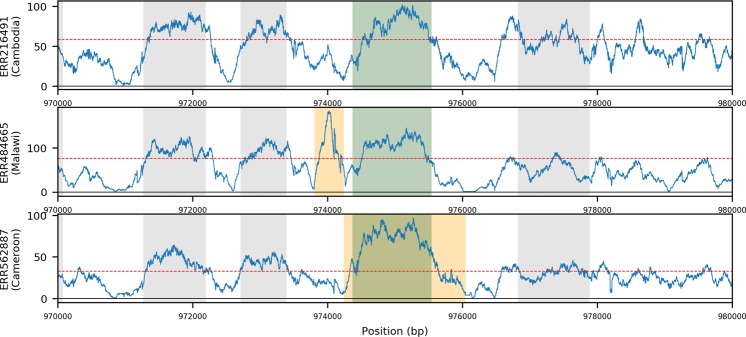
Figure 3.
Coverage plots showing examples of isolates with three types of gch1 duplications. (A) No duplication in a Cambodian isolate. (B) Promoter duplication in a Malawian isolate. (C) Gene Duplication in a Cameroon isolate; Blue traces represent the per base coverage for each isolate. Orange region indicates the predicted structural variant; Green region indicates the gene of interest, Grey indicates neighbouring genes; horizontal line is the median coverage for the isolate.

