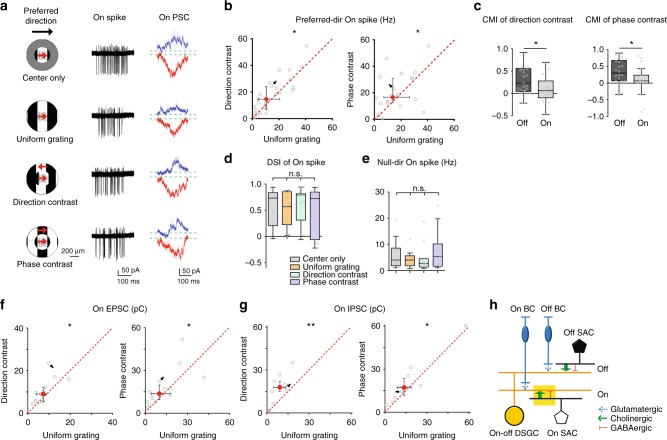
Fig. 4.
Contextually sensitive cholinergic excitation underlies the weak contextual modulation of pDSGC On response. a Left: Visual stimuli with different motion contexts. Middle: Example On spike traces of a pDSGC from a control mouse. Right: Whole-cell recording traces of On IPSCs (blue) and On EPSCs (red) from a pDSGC in a control mouse. b Scatter plots compare pDSGC preferred-direction On spike firing rate during uniform grating and compound gratings. Direction-contrast vs uniform grating: n = 27 cells from 10 mice, *p = 0.036; Phase-contrast vs uniform grating: n = 22 cells from 8 mice, *p = 0.046 (Wilcoxon signed-rank test). c Summary graphs compare CMI of pDSGC Off and On response in control mice. CMI of direction-contrast: *p = 0.014; CMI of phase-contrast: *p = 0.034; Wilcoxon rank-sum test, using the same sample group as Figs 1d and 3b. d DSI of pDSGC On response under different stimulus conditions. Friedman test: n = 11 cells from 4 mice, p = 0.48. e pDSGC On firing rate when center gratings drift in the null direction. Friedman test: n = 11 cells from 4 mice, p = 0.43. f Same as b, but for On EPSC charge transfer. Direction-contrast vs uniform grating: n = 13 cells from 10 mice, *p = 0.017; Phase-contrast vs uniform grating: n = 15 cells from 9 mice, *p = 0.035. g Same as b, but for On IPSC charge transfer. Direction-contrast vs uniform grating: n = 9 cells from 5 mice, **p = 0.0039; Phase-contrast vs uniform grating: n = 10 cells from 6 mice, *p = 0.037. h Schematic diagram shows the synaptic connections modulated by motion context in the On pathway (yellow filled rectangle). See also Supplementary Fig. 1a showing comparable spike firing rate of pDSGC On and Off response, Supplementary Fig. 1c for suppression index of On spikes and Supplementary Fig. 2b for pDSGC On responses in the present of DHβE

