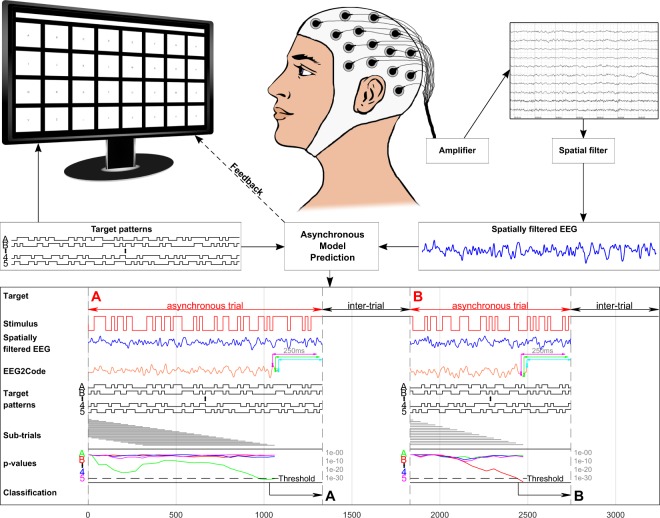
Figure 1.
Setup of the asynchronous BCI experiment. The matrix-keyboard layout is as shown on the monitor, it has 32 targets labeled alphabetically from A to Z followed by ‘_’ and numbers 1 to 5. The targets are separated by a blank black space and above the keyboard is a text field showing the written text. Each target is modulated with its own random stimulation pattern. During a trial, a spatial filter is continuously applied to the measured EEG. For each 250 ms window (slided sample-wise) of the spatially filtered EEG signal (blue line), the EEG2Code model predicts a real value (orange line) which highly correlates to the stimulation pattern. For simplicity, it is only shown for 3 exemplary windows (magenta, green, cyan). Note that the model prediction is delayed by 250 ms because of the sliding window approach. The resulting model prediction is then continuously compared to the stimulation patterns of all targets using a significance measure (p-value), whereby this is done for sub-trials (grey lines) of dynamic length. Once the maximum sub-trial length is reached, the sub-trial window will be shifted, meaning the beginning of the trial will be discarded. If at any time one of the p-values is lower than a user-specific threshold (calculated beforehand), the trial stops and the corresponding target will be selected, this is indicated to the participant by highlighting the target in yellow and the corresponding letter is appended to the text field. After an inter-trial time of 0.5 s the next trial starts. Picture modified from our previous work21.

