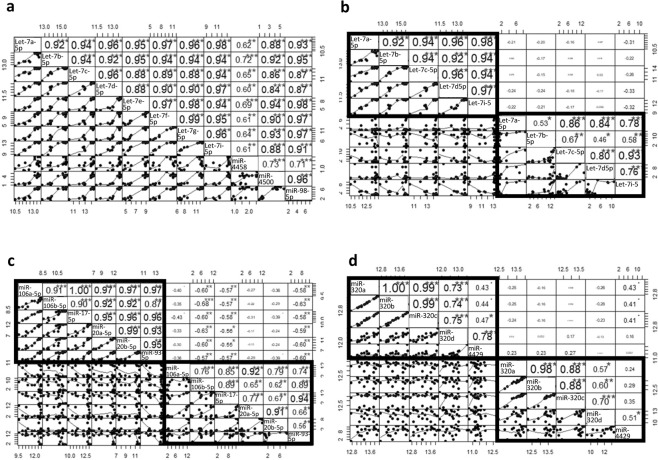
Figure 5.
(a) Correlation chart of the let7 family members in whole blood. Correlation chart of the let7 family (b), miR-17 family (c), and miR-320 family members (d) in both whole blood and serum. The upper-right side shows the correlation coefficient and p-value for each pairwise correlation. The lower-left side show the distribution. b,c and d show the correlation for the miRNA that are expressed in both biofluids. Intra-blood correlations (black quadrants) and intra-serum correlations (grey quadrants) are reported. Outside the quadrants the pairwise inter-biofluids correlations.

