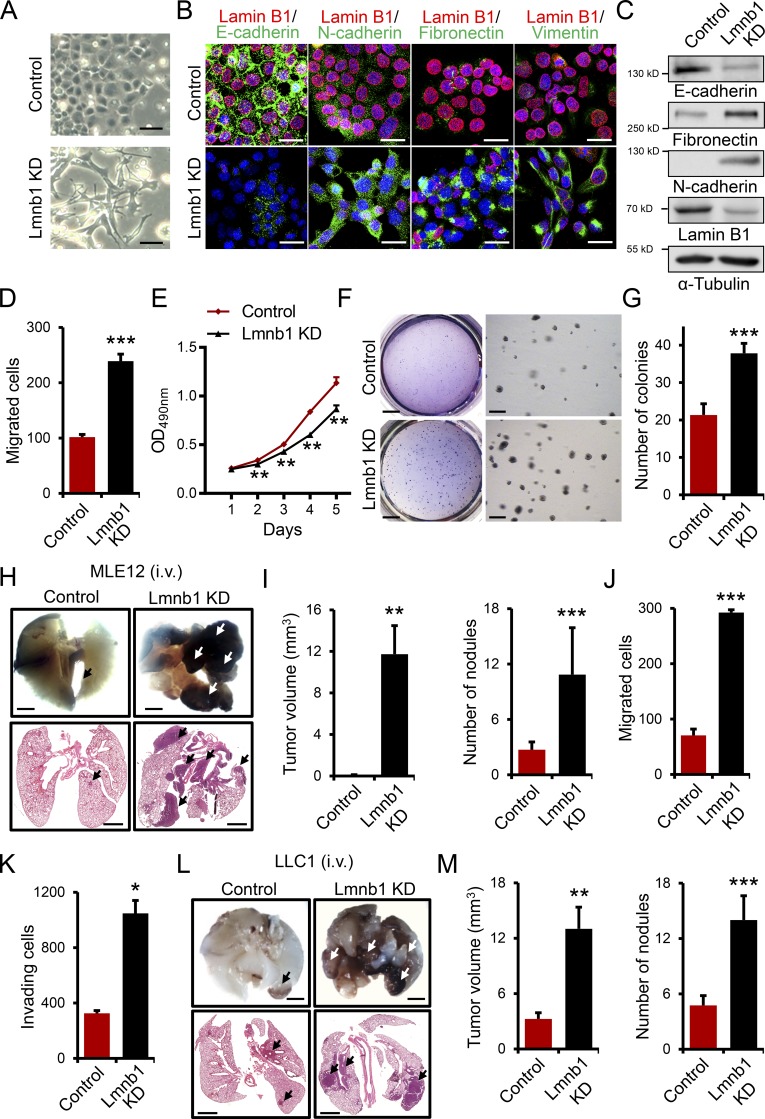
Figure 2.
Lamin B1 silencing promotes EMT, tumor growth, and metastasis. (A) Images of control and lamin B1 KD (Lmnb1 KD) MLE12 cells showing morphological changes after lamin B1 silencing. Scale bars, 50 µm. (B and C) Immunostainings (B) and Western blot analysis (C) for EMT markers in control and lamin B1 KD MLE12 cells. Cell nuclei were labeled by DAPI. Scale bars, 20 µm. (D) Boyden chamber migration assay with control and lamin B1 KD MLE12 cells (n = 4). (E) MTS cell proliferation assay to determine the effect of lamin B1 loss on cell proliferation (n = 8). (F) Soft agar assay to assess the anchorage independent cell growth of control and lamin B1 KD MLE12 cells. Higher magnifications (right panels) show the increased colony size upon lamin B1 loss (n = 6). Scale bars of left panels, 4 mm; scale bars of right panels, 0.5 mm. (G) Quantification of the number of colonies per field in the soft agar assay. (H and I) Control and lamin B1 KD MLE12 cells were injected intravenously into the tail vein of BALB/c nu/nu mice. After 24 d, mice were sacrificed and examined for tumor metastases in the lungs. Macroscopic appearance (H, top) and H&E (H, bottom) staining of representative lungs. Arrows indicate metastatic nodules. Scale bars, 2 mm. (I) Quantification of the microscopic tumor volume and metastatic nodules. n = 9 for the control, 8 for the Lmnb1 KD group (MLE12). (J and K) Boyden chamber migration (J) and invasion (K) assay with control and lamin B1 KD LLC1 cells (n = 4). (L and M) Control and lamin B1 KD LLC1 cells were injected intravenously into the tail vein of C57BL/6 mice for 20 d. Macroscopic appearance (L, top) and H&E (L, bottom) staining of representative lungs. Arrows indicate metastatic nodules. Scale bars, 2 mm. (M) Quantification of the macroscopic tumor volume and metastatic nodules. n = 8 for the control and Lmnb1 KD groups (LLC1). Results (B–G, J, and K) are representative of a minimum of three independent experiments. Statistical analysis was performed using Student’s t test with two-tailed distribution. Data are mean ± SEM. *, P < 0.05; ** P < 0.01; ***, P < 0.001.

