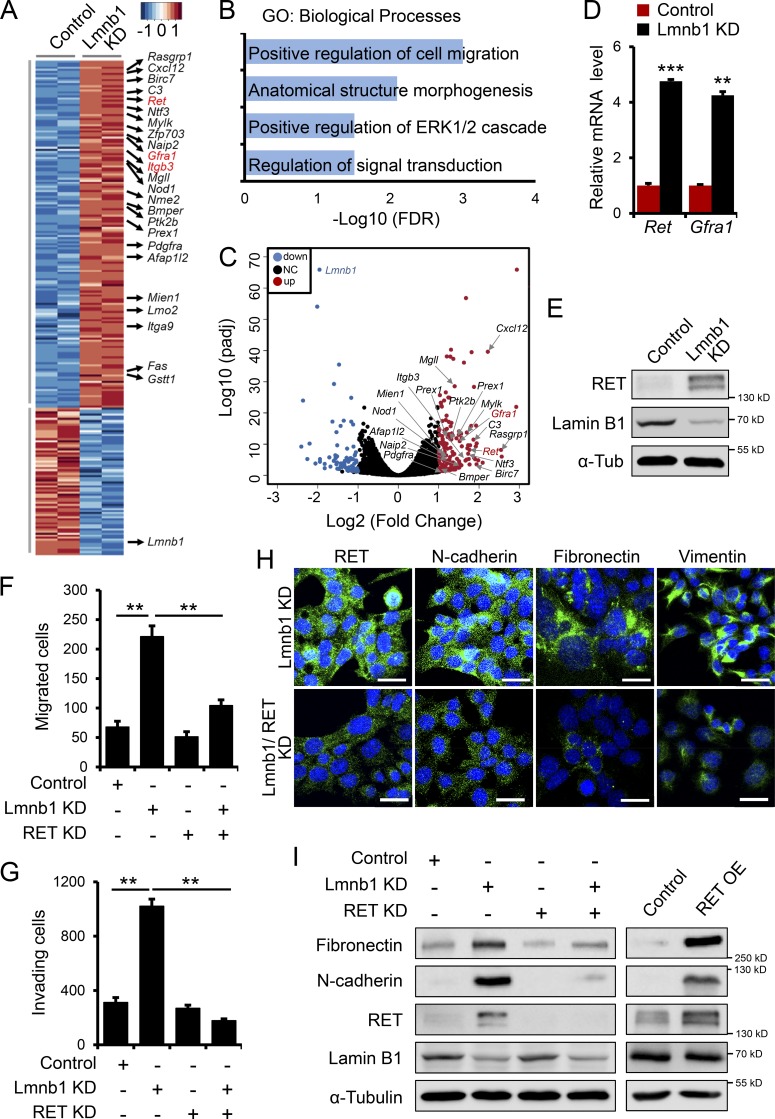
Figure 3.
RET upregulation mediates the EMT phenotype upon lamin B1 loss. (A) Heat-map representation of RNA-seq analysis of control (n = 2) and lamin B1 KD MLE12 (n = 2) cells, showing a large number of genes involved in cancer development among the genes upregulated upon lamin B1 loss of function. (B) GO terms enriched among genes upregulated upon lamin B1 KD (n = 2, fold-change >2; P < 0.05). (C) Volcano plot showing log2 fold-change plotted against log10-adjusted P value (padj) for lamin B1 KD versus control MLE12 samples. Red dots represent genes upregulated and blue dots represent genes downregulated (adjusted P < 0.05, fold-change ≤0.5, ≥2) upon lamin B1 loss of function; NC, not changed. Genes involved in cell migration and signaling are indicated. (D) qPCR validation of Ret and Gfra1 upregulation upon lamin B1 depletion (n = 6). (E) Western blot analysis for RET in control and lamin B1 KD MLE12 cells. (F) Boyden chamber migration assay with control, lamin B1 KD (Lmnb1 KD), RET KD (RET KD), and lamin B1/RET double-KD MLE12 cells (n = 4). (G) Boyden chamber invasion assay with control, Lmnb1 KD, RET KD, and lamin B1/RET double-KD LLC1 cells (n = 4). (H) Immunostaining for mesenchymal markers in lamin B1 KD and lamin B1/RET double-KD MLE12 cells. Cell nuclei were labeled by DAPI. Scale bars, 20 µm. (I) Western blot analysis for mesenchymal markers in control, lamin B1 KD, RET KD, and lamin B1/RET double-KD MLE12 cells or control and RET-overexpressing MLE12 cells. Results (D–I) are representative of a minimum of three independent experiments. Statistical analysis was performed using Student’s t test with two-tailed distribution. Data are mean ± SEM. **, P < 0.01; ***, P < 0.001. OE, overexpressing; α-Tub, α-tubulin.

