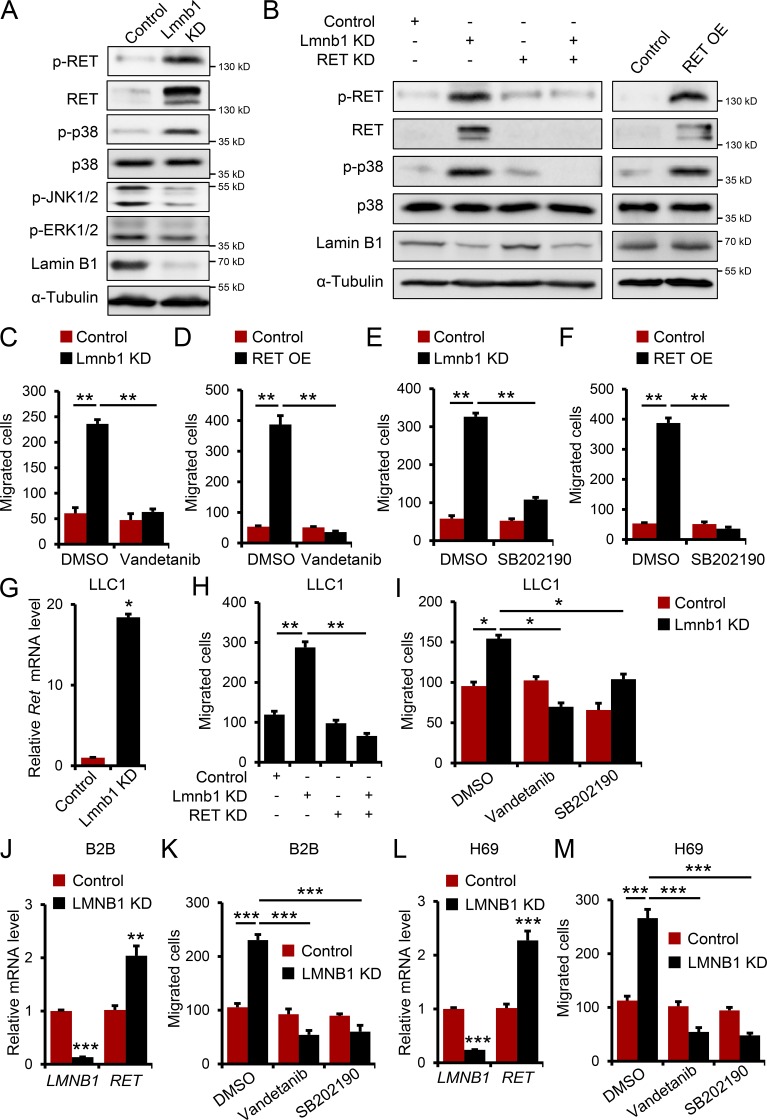
Figure 4.
Inhibition of RET/p38 signaling attenuates the highly migratory phenotype of lamin B1–depleted lung epithelial cells. (A) Western blot analyses for activated RET (phospho-Y1062-RET), p38, JNK, and ERK1/2 of control and lamin B1 KD MLE12 cells. (B) Western blot analyses for RET, p38, activated p-RET, and p-p38 in control, lamin B1 KD, RET KD, and lamin B1/RET double-KD MLE12 cells or control and RET-overexpressing MLE12 cells. (C and D) Boyden chamber migration assay with control and lamin B1 KD (C) or control and RET-overexpressing (D) MLE12 cells treated with 20 nM vandetanib (n = 4). (E and F) Boyden chamber migration assay with control and lamin B1 KD (E) or control and RET-overexpressing (F) MLE12 cells treated with 30 µM SB202190 (n = 4). (G) Relative expression level of Ret in control and lamin B1 KD LLC1 cells (n = 6). (H and I) Boyden chamber migration assay with control, lamin B1 KD, RET KD , and lamin B1/RET double-KD LLC1 cells (H) or control and lamin B1 KD LLC1 cells treated with 20 nM vandetanib or with 30 µM SB202190 (I; n = 4). (J and L) Relative expression level of RET in control and lamin B1 KD B2B normal human lung bronchial epithelial cells (J) or H69 SCLC cells (L; n = 6). (K and M) Boyden chamber migration assay with control and lamin B1 KD B2B cells (K) or control and lamin B1 KD H69 cells (M) treated with 20 nM vandetanib or with 30 µM SB202190 (n = 4). Results (A–C, E, and G–I) are representative of a minimum of three independent experiments. Data shown in D, F, and J–M are representative of two independent experiments. Statistical analysis was performed using Student’s t test with two-tailed distribution. Data are mean ± SEM. *, P < 0.05; **, P < 0.01; *** P < 0.001. OE, overexpressing.

