Figure 6.
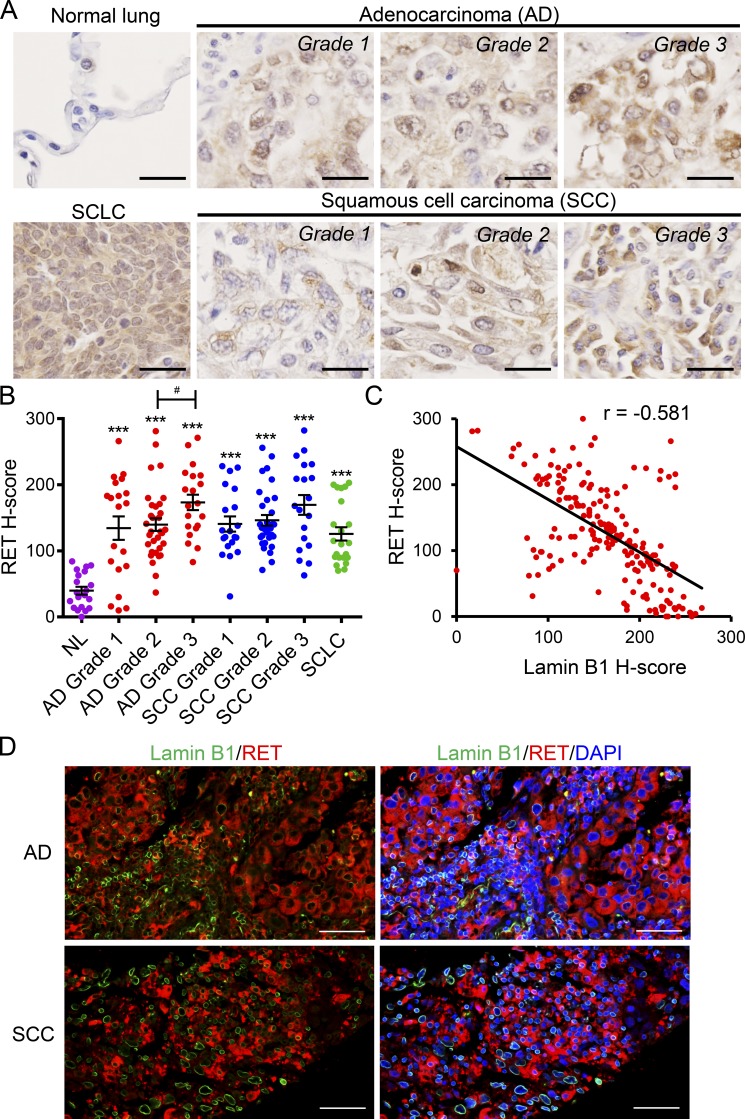
Lamin B1 and RET expression show inverse correlation in lung cancer patients. (A) IHC of representative tissue samples from different types and grades of lung tumors, from a tissue microarray, stained with an anti-RET antibody. Scale bars, 25 µm. (B) Relative RET staining intensity (H-score) in lung tumors of different types and grades. n = 70 adenocarcinoma (20 grade 1, 30 grade 2, 20 grade 3); n = 69 SCC (16 grade 1, 33 grade 2, 20 grade 3); n = 22 SCLC; and n = 20 normal lung tissue (NL). ***, P < 0.001 versus normal lung tissue. #, P < 0.05. AD, adenocarcinoma. (C) Correlation between the relative staining intensity for lamin B1 and RET; r, Pearson correlation coefficient. (D) Coimmunostaining of representative adenocarcinoma and SCC grade 3 samples with RET and lamin B1 antibodies showing that cells highly positive for lamin B1 express low levels of RET and vice versa. Scale bars, 50 µm.

