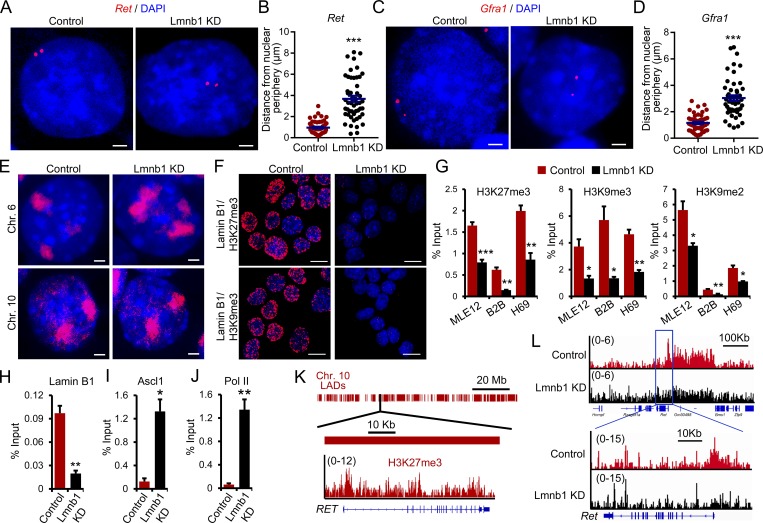
Figure 7.
Lamin B1 loss alters gene positioning and chromatin landscape. (A–D) Representative DNA FISH images of Ret (A) and Gfra1 (C) genes (red) in control or Lmnb1 KD MLE12 cells. Cell nuclei were labeled by DAPI. Scale bars, 2 µm. Quantification of the distance of the Ret (B) and Gfra1 (D) genes to the nuclear periphery in individual nuclei of control or Lmnb1 KD MLE12 cells (n = 50). (E) FISH chromosome painting of Chr. 6 and Chr. 10 in control or Lmnb1 KD MLE12 cells. (F) PLA using either lamin B1 and H3K27me3 or lamin B1 and H3K9me3 antibodies. Scale bars, 10 µm. (G) ChIP-qPCR analysis of H3K27me3, H3K9me3, and H3K9me2 occupancy at the Ret promoter (n = 4). (H–J) ChIP-qPCR analysis of lamin B1 (H), Ascl1 (I), and Pol II binding (J) at the Ret promoter (n = 4). (K) Schematic representation of the RET gene and its localization in LADs (top). Genome tracks of H3K27me3 of human lung tissue showing that the RET promoter is decorated with H3K27me3 mark. (L) Genome tracks of H3K27me3 ChIP-seq in control and lamin B1 KD MLE12 cells (n = 2). Images in A, C, E, and F are representative of a minimum of two independent experiments. Data shown in B, D, and G–J are mean ± SEM of a minimum of two independent experiments. Statistical analysis was performed using Student’s t test with two-tailed distribution. *, P < 0.05; **, P < 0.01; ***, P < 0.001.

