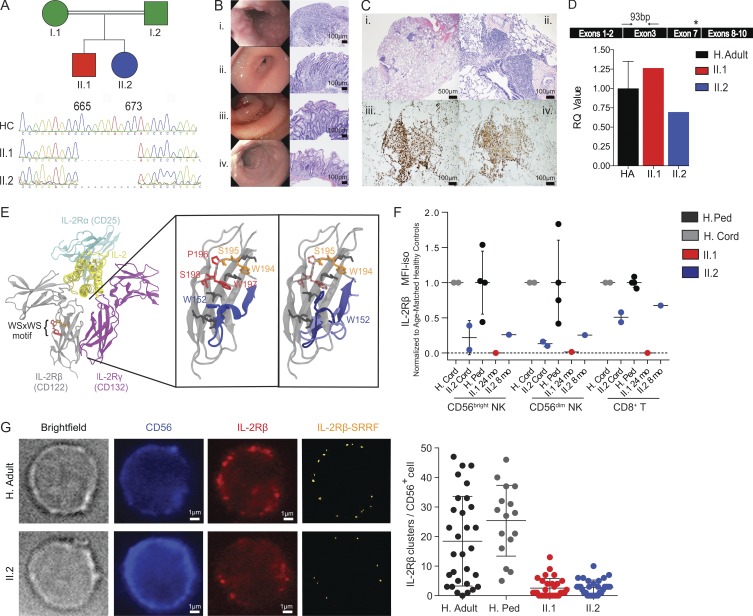
Figure 1.
Identification of an IL2RB homozygous mutation in patients with lymphoproliferation and autoimmunity. (A) Pedigree of the consanguineous parents with two affected children and chromatogram showing the 9-nucleotide deletion in the IL2RB gene. (B) Patient II.1 endoscopy of the (i) esophagus with severe nodularity with the submucosal lymphoid hyperplasia; (ii) stomach with edema of the antrum with chronic active gastritis; (iii) duodenum with erythema, edema, and loss of villous profile; and (iv) colon with small superficial aphthous ulcerations with chronic active colitis. Bars, 100 µm. (C) Patient II.2 bronchoscopy shows (i) lymphocytic interstitial pneumonia pattern; (ii) patchy peri-airway and intraalveolar macrophage accumulation, with a predominant CD8+ and CD4+ T lymphocyte infiltrate (iii and iv). Bars, 500 or 100 µm. (D) IL2RB gene expression quantification relative to actin (HA in black, n = 3, 1 ± 0.35; one experiment). Cartoon shows primer position (black arrows) relative to deletion (asterisk). RQ, relative quantification. (E) 3D modeling of the IL-2Rβ protein structure, with disruption of the WSXWS motif in the patients (from left to right): the IL-2R complex is shown in ribbons. The WSXWS motif is shown in red and orange. In the expanded view of the IL-2Rβ protein D2 domain with the WSXWS motif, the three residues that are deleted in the patient are shown in red (translucent in patient). Adjacent residues involved in the π cation-stacking ladder are shown in dark gray. (F) Normalized surface IL-2Rβ protein expression mean fluorescence intensity (MFI) in CD56bright NK, CD56dim NK, and CD8+ T cells. The MFI is calculated as IL-2Rβ MFI − isotype control MFI normalized to the mean for each cell type. Healthy cord (H. cord) and pediatric controls (H. Ped; age 12–30 mo) were normalized independently. For cord comparisons, two experiments with different healthy cord donors are shown. For pediatric comparisons, one experiment with four healthy pediatric controls is shown. Ped, pediatric. (G) Representative bright-field and immunofluorescence images of CD56 and IL-2Rβ staining are shown for healthy adult (H. Adult; top) and patient II.2 (bottom). Number of IL-2Rβ clusters per cell in one healthy adult (18.43 ± 15.16, cells = 30), three pediatric controls (25.38 ± 12, cells = 16), patient II.1 (2.567 ± 3.256, cells = 30), and patient II.2 (2.8 ± 2.497, cells = 30) is shown as a dot graph where each dot represents one cell. Bars, 1 µm. Two experiments were performed. Mean ± SD is shown.

