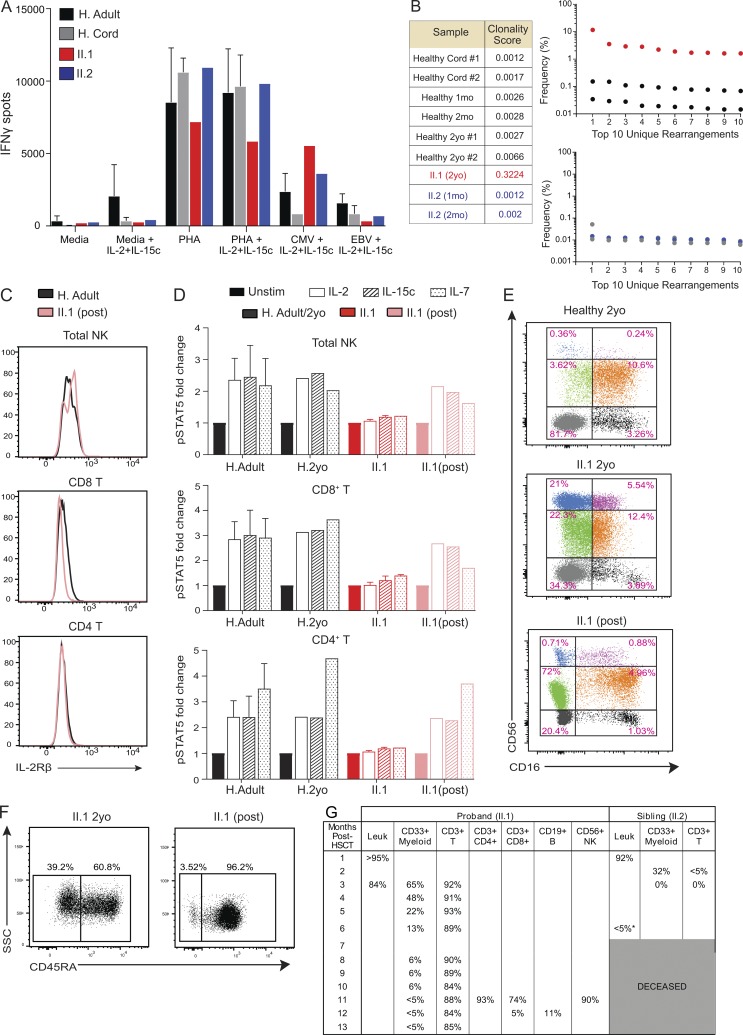
Figure 4.
T cell immunophenotypic and functional characterization in patient II.1. (A) Production of IFNγ in response to PHA, EBV, and CMV ± IL-2/15c was measured by ELISPOT. Healthy adults (H. Adult; n = 7) and cord blood samples (H. Cord; n = 3) were used with patient samples (n = 1 for each) in one experiment. (B) TCR sequencing was performed in patients and healthy controls, and clonality scores are shown. Graphs show the frequency of the top 10 TCR rearrangements unique to patients and their respective age-matched healthy controls. Each numbered TCR rearrangement is different and unique for each patient and control. (C) Histograms of IL-2Rβ surface protein expression in patient II.1 post-HSCT and healthy control. (D) Normalized pSTAT5 responses in cell types as indicated. PBMCs were stimulated with IL-2 (1 µg/ml) or IL-15c (1 µg/ml) for 30 min. Fold change in MFI is calculated as pSTAT5 MFI for each condition normalized to the unstimulated (unstim) condition for each individual. Data merged from two experiments with II.1 pre- and post-HSCT compared with healthy adults (H. Adult, n = 7) and healthy 2 yr old (n = 1). (E) Representative dot plots show NK cell subsets dissected based on CD56 versus CD16 from the CD3−CD19−CD14−CD33− gate from one experiment. (F) Representative dot plots show SSC versus CD45RA+ from the CD3+ gate in patient II.1 pre- and post-HSCT. Two experiments shown. (G) Percentage of lymphoid and myeloid chimerism in patients II.1 and II.2 post-HSCT. mo, months old; yo, years old. Mean ± SD is shown.

