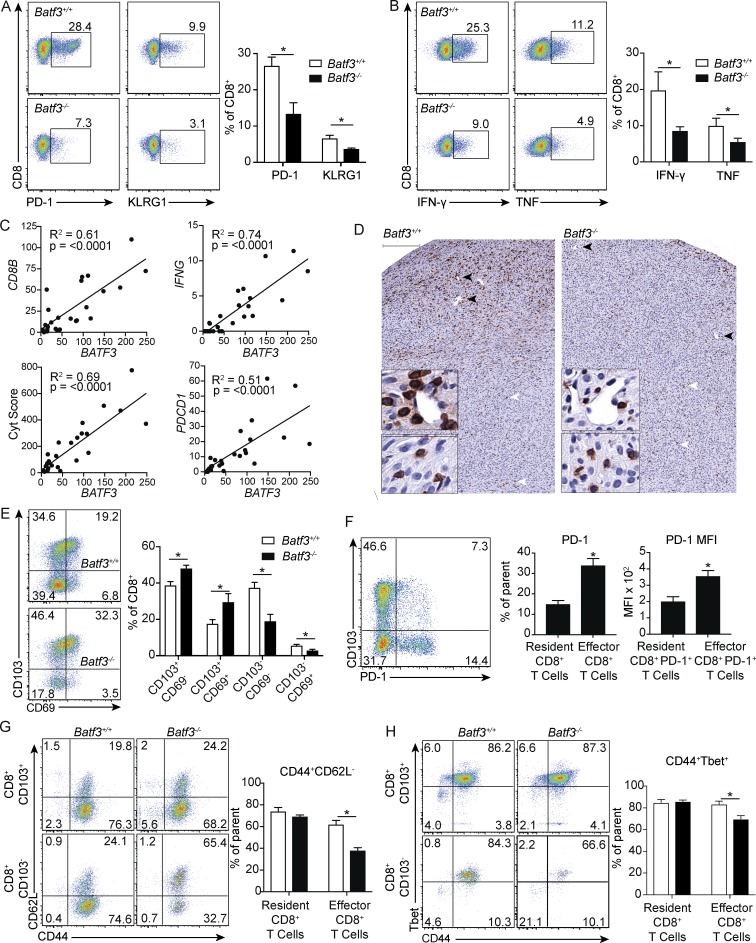
Figure 2.
Batf3 dependence distinguishes resident memory from antitumor effector CD8+ T cells. (A) Flow cytometry and frequency of PD-1 and KLRG1 on CD8+ T cells from tumors of untreated KitV558Δ/+;Batf3+/+ and KitV558Δ/+;Batf3−/− mice (six mice/group pooled from two experiments). (B) Tumor cell suspensions from KitV558Δ/+;Batf3+/+ and KitV558Δ/+;Batf3−/− mice were stimulated with PMA and ionomycin in the presence of brefeldin A followed by intracellular analysis of IFN-γ and TNF in CD8+ T cells (five mice/group, representative of two independent experiments). (C) Normalized gene expression of BATF3 was plotted against CD8B, IFNG, and the cytolytic score from 26 untreated human GIST specimens. (D) Untreated tumors in KitV558Δ/+;Batf3+/+ and KitV558Δ/+;Batf3−/− mice were stained for CD8. Top bar represents 200 µm. Black arrowheads point to staining in periphery and correspond to top inset. White arrowheads point to staining in central core and correspond to lower inset. Inset bar represents 50 µm (representative of three mice/group). (E) Flow cytometry and frequency of CD103 and CD69 on CD8+ T cells from untreated tumors of KitV558Δ/+;Batf3+/+ and KitV558Δ/+;Batf3−/− mice (six mice/group pooled from two experiments). (F) Flow cytometry and frequency of PD-1 on CD103+ resident and CD103− effector CD8+ T cells and PD-1 MFI of PD-1+ effector and PD-1+ resident CD8+ T cells from tumors of KitV558Δ/+;Batf3+/+ mice (five mice/group, representative of two independent experiments). (G) Flow cytometry and frequency of CD44 and CD62L on resident CD8+CD103+ and effector CD8+CD103− T cells from tumors of KitV558Δ/+;Batf3+/+ and KitV558Δ/+;Batf3−/− mice (five mice/group, representative of two independent experiments). (H) Flow cytometry and frequency of CD44 and Tbet on resident and effector CD8+ T cells from tumors of KitV558Δ/+;Batf3+/+ and KitV558Δ/+;Batf3−/− mice (four mice/group, pooled from two experiments). Data represent mean ± SEM; P values were calculated using a Student’s t test; *, P < 0.05. Correlation is shown using R2, and significance was determined using Spearman correlation.

