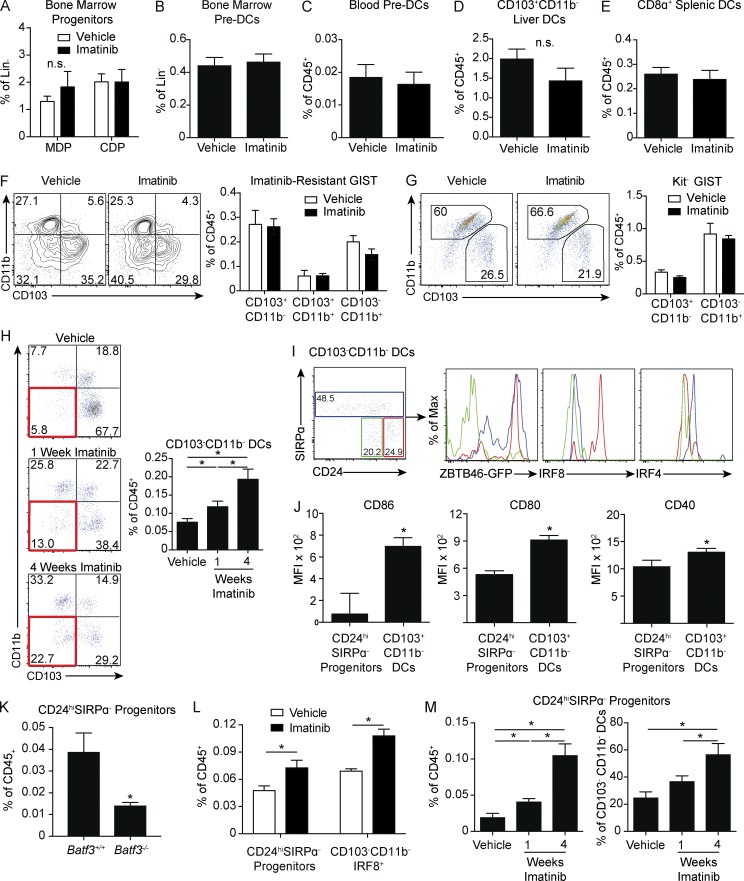
Figure 4.
Kit oncogene inhibition leads to the accumulation of CD103+CD11b− DC progenitors. (A–E) KitV558Δ/+ mice were treated with vehicle or imatinib for 1 wk and analyzed for (A) frequency of Lin−CSF1R+CD117+MHC II−CD11c−CD135+ MDPs and lin−CSF1R+CD117intMHC II−CD11c−CD135+ CDPs in the bone marrow (five mice/group); (B) Lin−CD11c+MHC II−CD135+SIRPαint preDCs in the bone marrow (four mice/group); (C) Lin−CD11c+MHC II−CD135+SIRPαint preDCs in the peripheral blood (four mice/group); (D) Siglec F−F4/80−CD11c+MHC II+CD103+CD11b− DCs in the liver (five mice/group); and (E) CD11c+MHC II+CD8α+ DCs in the spleen (five mice/group). A–E are representative of two independent experiments. (F) Flow cytometry and frequency of DC subsets in tumors were analyzed in KitV558Δ;T669I/+ mice treated with vehicle or imatinib for 1 wk (six mice/group pooled from two independent experiments). (G) S2 cells were injected into the flanks of wild-type mice. After 3 wk of growth, imatinib was administered for 1 wk. Flow cytometry and frequency of DC subsets were analyzed (five mice/group, representative of two independent experiments). (H) Tumors of KitV558Δ/+ mice treated with vehicle or imatinib for 1 or 4 wk were analyzed by flow cytometry for DC populations. Red box identifies CD103−CD11b− DCs. Graph represents frequency of CD103−CD11b− DCs as a percentage of CD45+ cells (four to five mice/group, representative of two independent experiments). (I) Flow cytometry of CD103−CD11b− DCs distinguished by CD24 and SIRPα expression in tumors of untreated KitV558−/+ mice. Histograms represent transcription factor expression within these subsets. Histogram color matches gating within the CD103−CD11b− DC compartment (five mice/group). (J) CD86, CD80, and CD40 MFI in CD24hiSIRPα− progenitors and CD103+CD11b− DCs in tumors of untreated KitV558Δ/+ mice (five mice/group). I and J are representative of two independent experiments. (K) Untreated tumors in KitV558Δ/+;Batf3+/+ and KitV558Δ/+;Batf3−/− mice were analyzed for frequency of CD24hiSIRPα− progenitors (three mice/group, representative of two independent experiments). (L) Frequency of CD24hiSIRPα− progenitors and IRF8+ progenitors in tumors of KitV558Δ/+ mice treated with vehicle or imatinib for 1 wk (four mice/group, representative of two independent experiments). (M) Frequency of CD24hiSIRPα− progenitors as a percentage of CD45+ or CD103−CD11b− DCs in tumors of KitV558Δ/+ mice treated with vehicle or imatinib for 1 or 4 wk (four to five mice/group, similar results obtained in experiments separately analyzing 1- and 4-wk treatment durations). Data represent mean ± SEM; P values were calculated using a Student’s t test; *, P < 0.05. n.s., not significant.

