Figure 5.
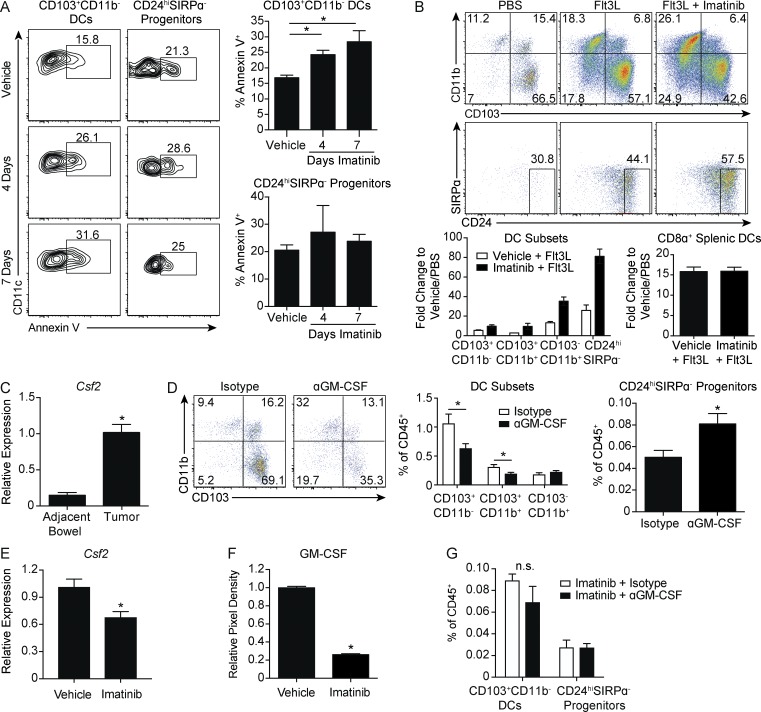
GM-CSF is required for CD103+CD11b− DCs and is decreased by imatinib. (A) Tumors of KitV558Δ/+ mice treated with vehicle or imatinib for 4 or 7 d were analyzed for apoptosis by Annexin V in CD103+CD11b− DCs or CD24hiSIRPα− progenitors (four mice/group, similar results obtained with a 4-wk treatment duration). (B) KitV558Δ/+ mice were treated with nine daily injections of PBS or Flt3L and vehicle or imatinib in the drinking water. Flow cytometry of DC subsets in tumors. Graph represents fold change of DC subsets in tumor and CD8α+ DCs in spleen with respect to PBS plus vehicle–treated mice (three mice/group, representative of two independent experiments). (C) Quantitative RT-PCR of Csf2 mRNA expression in tumor and adjacent bowel of untreated KitV558Δ/+ mice (two mice/group plated and analyzed in triplicate). (D) KitV558Δ/+ mice were treated with 1 mg of isotype or anti-GM-CSF antibody on days 0, 3, and 6. Mice were sacrificed on day 7. Flow cytometry and frequency of DC subsets (eight mice/group, pooled from two experiments). (E) Quantitative RT-PCR of Csf2 mRNA expression in tumors of KitV558Δ/+ mice treated with vehicle or imatinib for 1 wk (three mice/group, representative of two independent experiments). (F) Cytokine array against GM-CSF protein in tumors of KitV558Δ/+ mice treated with vehicle or imatinib for 1 wk. Graph represents relative pixel density (two mice/group, two biological replicates). (G) Mice treated as in D except that imatinib was present in the drinking water for both groups. Graph of frequency of CD24hiSIRPα− progenitors and CD103+CD11b− DCs (three mice/group). Data represent mean ± SEM; P values were calculated using a Student’s t test; *, P < 0.05. n.s., not significant.

