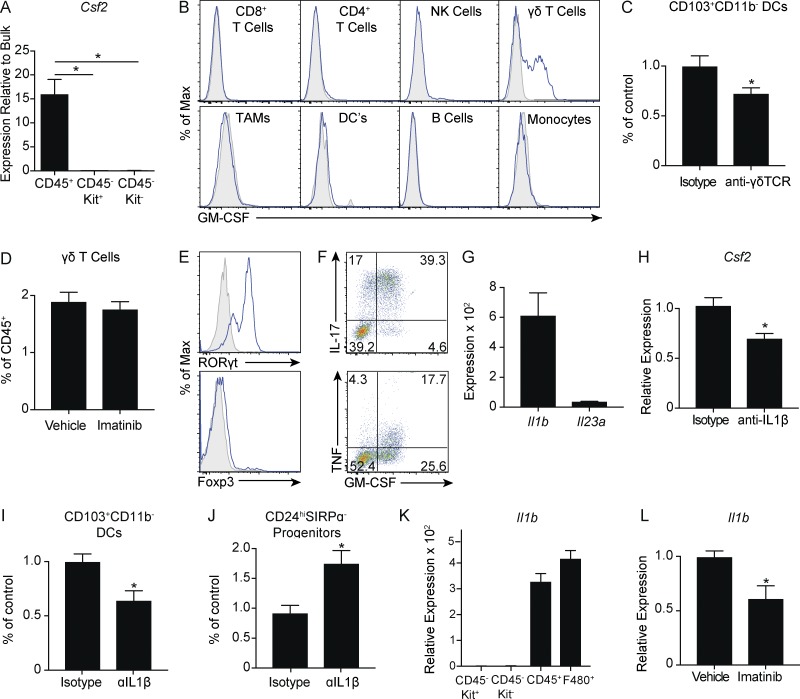
Figure 6.
Macrophages promote maturation of CD103+CD11b− DCs through GM-CSF+ γδ T cells via IL-1β. (A) CD45+ immune cells, CD45−Kit+ tumor cells, and CD45−Kit− stromal cells in untreated tumors of KitV558−/+ mice were isolated by magnetic beads. Graph represents quantitative RT-PCR of Csf2 mRNA expression relative to Kit+ tumor cells (three mice analyzed in duplicate). (B) Single-cell suspensions of tumors from KitV558Δ/+ mice were stimulated with PMA and ionomycin in the presence of brefeldin A and analyzed for intracellular GM-CSF in immune cells. (C) Tumors of KitV558Δ/+ mice were treated with 500 µg of isotype or anti-γδTCR antibody on day 0 and 250 µg every other day thereafter. Mice were sacrificed on day 14. Frequency of CD103+CD11b− DCs (seven mice/group pooled from two experiments). (D) Frequency of γδ T cells in tumors of KitV558Δ/+ mice treated with vehicle or imatinib for 1 wk (five mice/group, representative of two independent experiments). (E) γδ T cells in untreated KitV558Δ/+ tumors were analyzed for transcription factors by flow cytometry. (F) Single-cell suspensions of tumors from untreated KitV558Δ/+ mice were stimulated with PMA and ionomycin in the presence of brefeldin A and analyzed for intracellular cytokines in γδ T cells. (G) Intratumoral mRNA expression in untreated KitV558Δ/+ mice by Affymetrix array (three mice/group). (H) KitV558Δ/+ mice were treated every 3 d with 200 µg of isotype or anti–IL-1β and sacrificed on day 14. Quantitative RT-PCR of tumor Csf2 mRNA expression was performed (six to eight mice/group, pooled from two experiments). (I and J) Frequency of CD103+CD11b− DCs and CD24hiSIRPα− progenitors in mice treated as in H. (K) CD45+ immune cells, CD45−Kit+ tumor cells, CD45−Kit− stromal cells, and F4/80+ macrophages in untreated tumors of KitV558−/+ mice were isolated by magnetic beads. Quantitative RT-PCR of Il1b mRNA expression was performed relative to CD45−Kit+ tumor cells (four mice/group analyzed in triplicate). (L) Quantitative RT-PCR of Il1b mRNA expression in tumors of KitV558Δ/+ mice treated with vehicle or imatinib for 1 wk (three to four mice/group, representative of two independent experiments). Data represent mean ± SEM; P values were calculated using a Student’s t test; *, P < 0.05.

