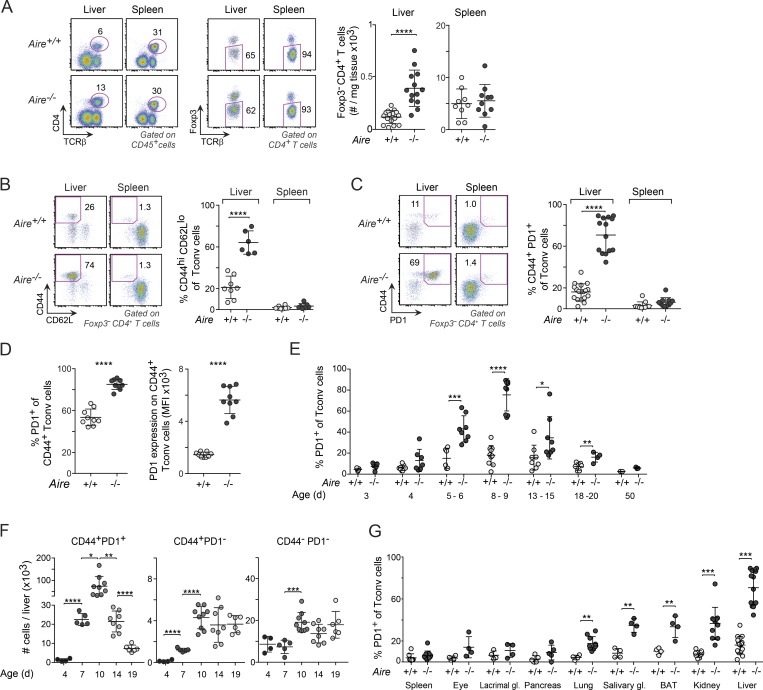
Figure 1.
PD-1+CD4+ T conv cells were enriched in nonlymphoid organs of Aire−/− perinates. (A) Quantification of Foxp3−CD4+ T cells from the liver and spleen of 8–10-d-old mice (n = 9–16 mice/group). (B and C) Frequency of CD44+CD62Llo (n = 7–8 mice/group; B) and CD44+PD-1+ (n = 11–18 mice/group; C) T conv cells from liver and spleen of 8–10-d-old mice. (D) Frequency of PD-1+ cells (left) and PD-1 mean fluorescence intensity (MFI; right) from the liver of 8–10-d-old Aire−/− mice (n = 9 mice/group). (E) Frequency of PD-1+ T conv cells from liver of mice of various ages (n = 3–8 mice/group). (F) Numbers of T eff cells and naive T conv cells in the liver of differently aged Aire−/− mice (n = 4–9 mice/group). (G) Frequency of PD-1+ T conv cells in the spleen and various nonlymphoid organs of 8–10-d-old mice (n = 4–16 mice/group). Representative flow cytometric plots in A–C show the gating strategy. Data are pooled from at least two independent experiments. Summary data (all panels) show mean ± SD. *, P ≤ 0.05; **, P ≤ 0.01; ***, P ≤ 0.001; ****, P ≤ 0.0001 (two-tailed unpaired Student’s t test).

