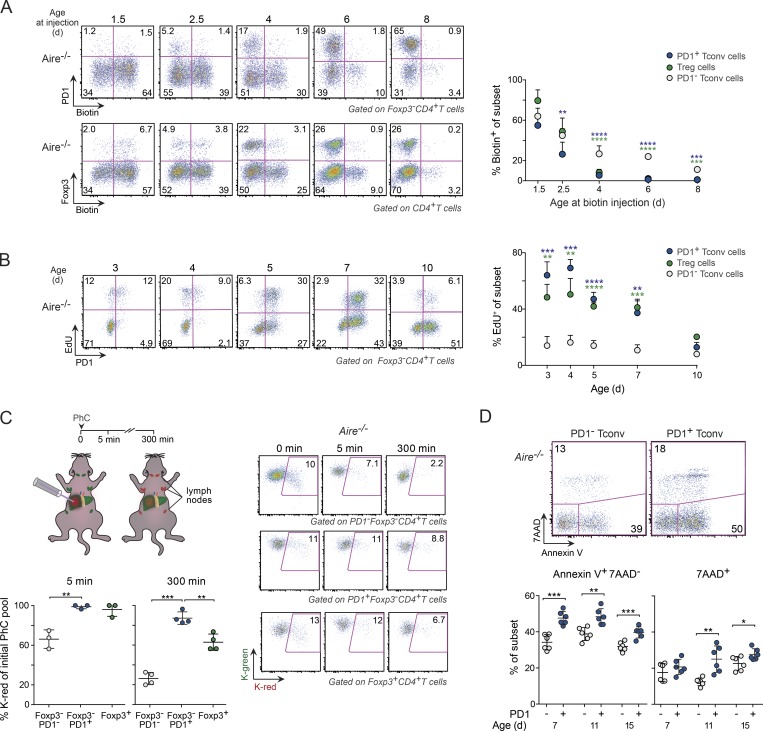
Figure 3.
T cell dynamics in the perinatal liver. (A) Analysis of biotin-labeled CD4+ T conv cells in the liver 12 h after intrathymic injection of biotin (n = 4–6 mice/group). (B) Proliferation of liver CD4+ T cells in differently aged Aire−/− perinates 4 h after EdU injection (n = 5–7 mice/group). (C) Frequency of photoconverted (PhC) CD4+ T cells (K-red) retained in the liver at various time points after light exposure of the organ in 6-d-old Kaede/B6.Aire−/− mice (n = 3–4 mice/group). (D) Annexin V+ and 7AAD+ liver T conv cells in Aire−/− mice of various ages (n = 6 mice/group). Data are pooled from two to four independent experiments and show mean ± SD. Statistical analyses as in Fig. 1. *, P ≤ 0.05; **, P ≤ 0.01; ***, P ≤ 0.001; ****, P ≤ 0.0001.

