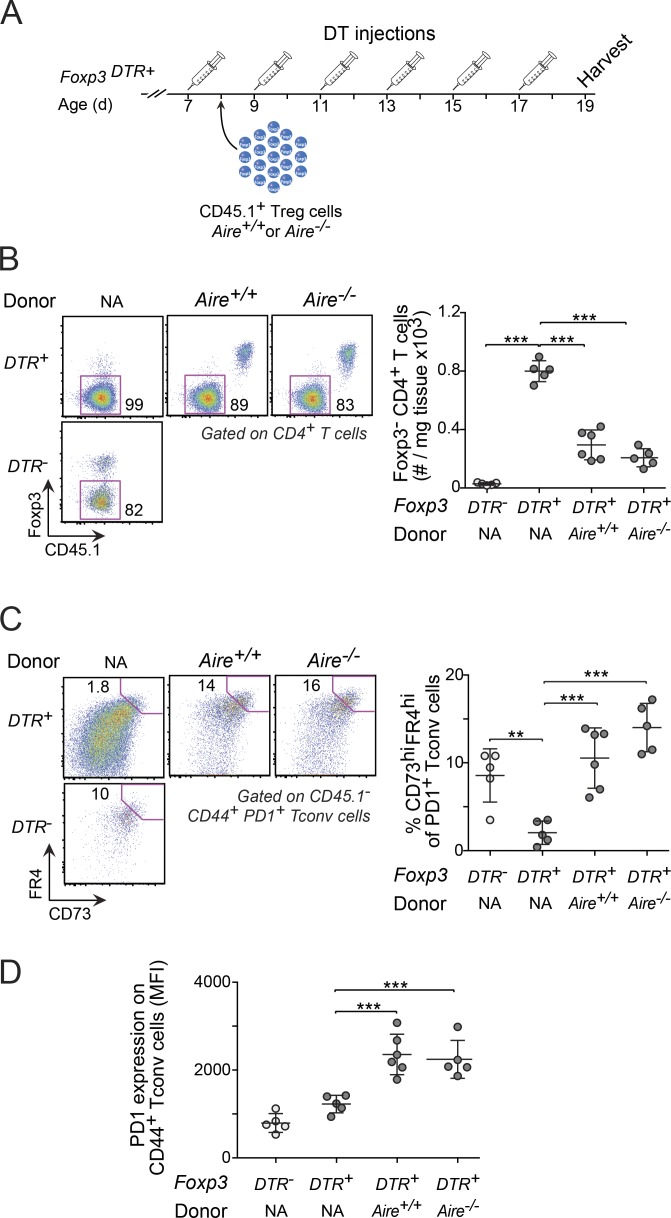
Figure 6.
The ability of T reg cells to maintain anergy in effector cells was independent of Aire. (A) Regimen for adoptive T reg cell transfer and DT treatment. (B) Numbers of T conv cells in the liver of recipient mice and controls. (C and D) Frequency of anergic T conv cells (C) and expression of PD-1 on T conv cells (D). Data are pooled from two independent experiments (all panels, n = 5–6 mice/group) and show mean ± SD. Statistical analyses as in Fig. 1. MFI, mean fluorescence intensity; NA, not applicable. **, P ≤ 0.01; ***, P ≤ 0.001.

