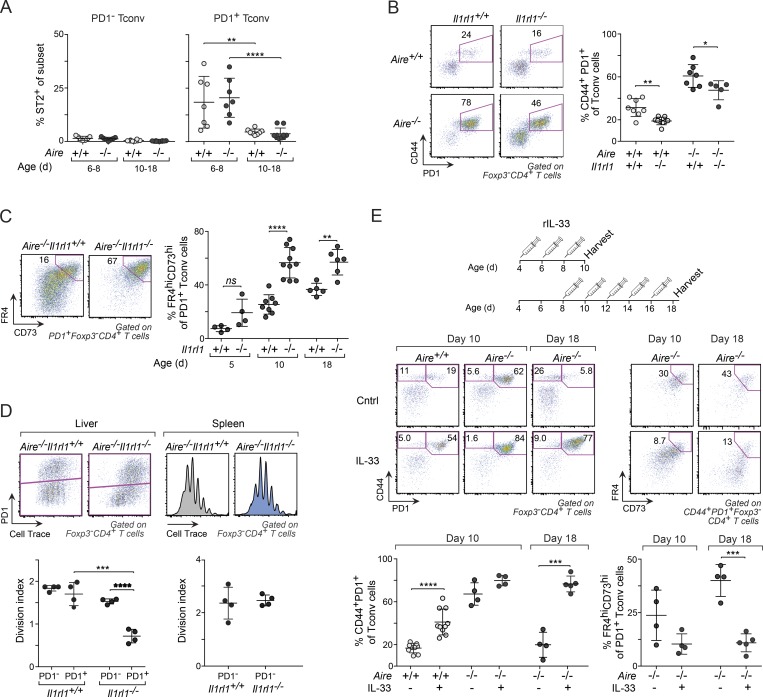
Figure 7.
ST2 signaling reined in anergy in perinatal liver T conv cells. (A) Frequency of ST2+ PD-1− and PD-1+ T conv cells in liver from differently aged perinates (n = 7–10 mice/group; see Fig. S4 A for gating strategy of ST2+ cells). (B) CD44+PD-1+ T conv cells from liver of 10-d-old mice (n = 5–8 mice/group). (C) Frequency of anergic (FR4hiCD73hi) PD-1+ T conv cells in Aire−/− mice of various ages (n = 4–10 mice/group). (D) Impact of ST2 deficiency on proliferation. αCD3/28 in vitro stimulation of sorted CellTrace violet–labeled liver and spleen CD4+ T cells from 6-d-old mice (n = 4 mice/group). (E) Frequency of total and anergic CD44+PD-1+ T conv cells form liver of IL-33–treated mice. Top: Treatment regimen. Bottom: Representative flow-cytometric plots and summary data (n = 4–10 mice/group). Data are pooled from at least two independent experiments and show mean ± SD. Statistical analyses as in Fig. 1. ns, not significant. *, P ≤ 0.05; **, P ≤ 0.01; ***, P ≤ 0.001; ****, P ≤ 0.0001.

